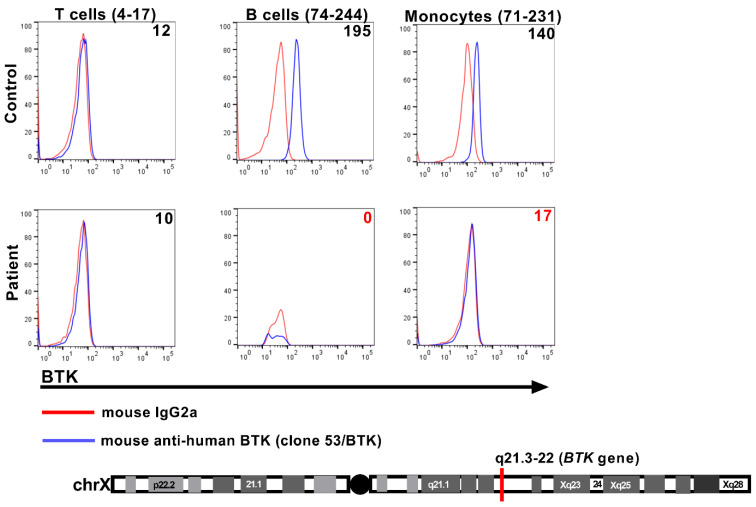
Figure 1.
Assessment of cytosolic BTK expression by flow cytometry. The histogram overlay plots display the presence and/or absence of BTK protein expression (blue histograms) in the cytosol of the indicated cellular subsets. The numbers listed in parentheses adjacent to the cell subset label reflect the clinically validated reference ranges (5–95th percentiles) for that particular cell subset, derived from the background-subtracted median fluorescence intensity (MFI) of BTK expression evaluated for 34 healthy control donors. The numbers listed within each histogram overlay plot reflect the background-subtracted MFI of BTK expression for that specific cell subset for each donor. The specificity of the BTK signal was determined by also separately staining the cells with a dose-matched, isotype control Ab (red histograms). T cells lack BTK expression and serve as an internal specificity control in the assay.

