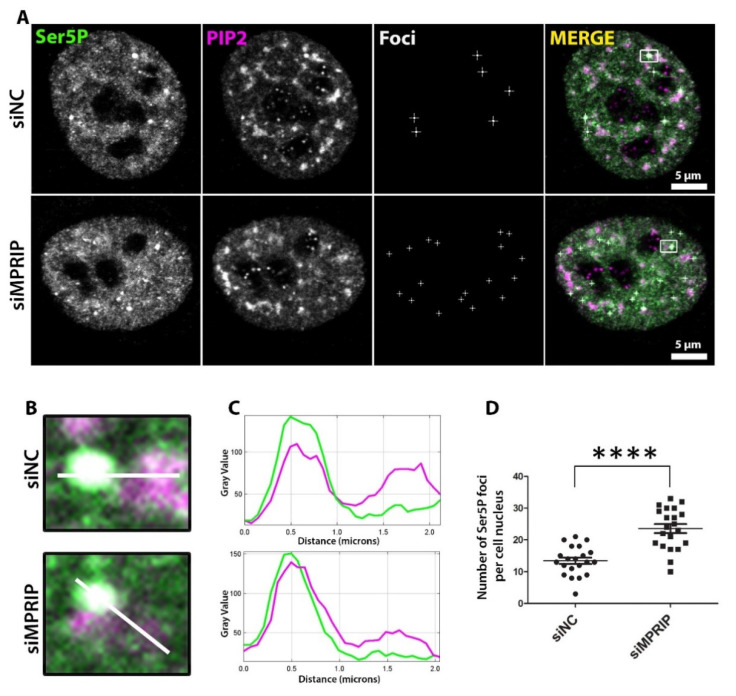
Figure 3.
The number of Ser5P-CTD foci increase upon MPRIP depletion in cell nuclei. (A) Immunofluorescence labeling experiment on U2OS cells showing the Ser5P-CTD foci in control (siNC—small interfering Negative Control RNAs) and MPRIP-depleted (siMPRIP—small interfering MPRIP RNAs) nuclei. Scale bars represent 5 µm. (B) Zoomed views of foci that are marked by a white rectangle in the “Merge” images. The white lines on the zoomed views represent the regions for the intensity plots on (C) where the upper plot corresponds to the intensities of siNC and lower, to siMPRIP. (D) The dot plot shows the number of Ser5P-CTD foci per cell nucleus of siNC and siMPRIP. The quadruple asterisks “****” correspond to a significance level of p ≤ 0.0001. n = 3.

