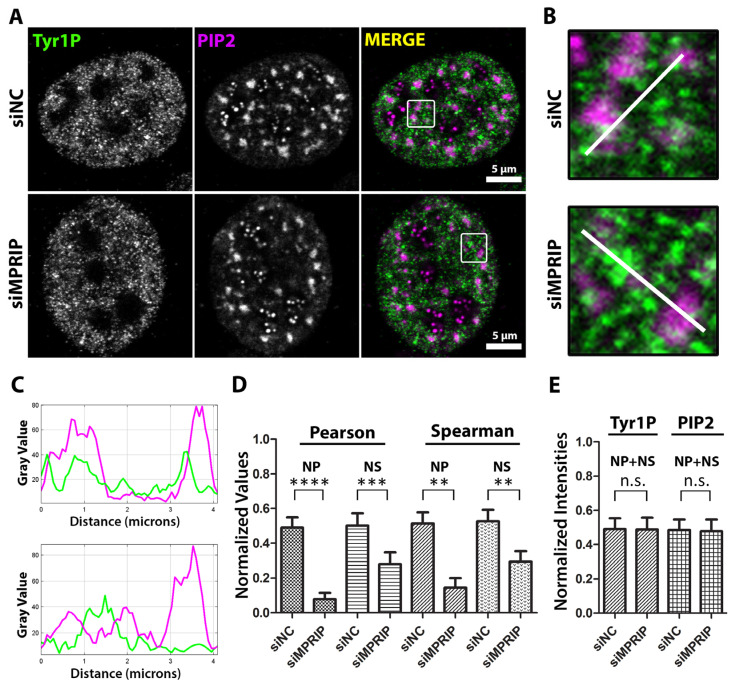
Figure 5.
MPRIP depletion leads to the decreased association of Tyr1 phosphorylated RNAPII to PIP2. (A) The immunofluorescence experiment visualized by a confocal microscope shows the mutual distribution of PIP2 and Tyr1P-CTD in control and MPRIP depleted U2OS nucleus. Scale bars represent 5 µm. (B) Zoomed views of the regions that are marked by a white rectangle in the “merge” images. The white lines on the zoomed views represent the regions of the intensity plots (C) where the upper plot corresponds to the intensities of siNC and the lower, to siMPRIP. (D) The column chart shows normalized values of Spearman’s and Pearson’s coefficients that are observed in different PIP2-rich nuclear compartments. (E) The integrated densities of Tyr1P-CTD and PIP2 signals are normalized and represented as a column chart in control (siNC—small interfering Negative Control RNAs) and MPRIP depleted (siMPRIP—small interfering MPRIP RNAs) conditions. NP—Nucleoplasmic, NS—Nuclear Speckles. n.s.—Not significant. The double asterisks “**” correspond to a significance level of p ≤ 0.01, the triple asterisks “***” correspond to a significance level of p ≤ 0.001, and the quadruple asterisks “****” correspond to a significance level of p ≤ 0.0001. n = 2, 10 cells/condition.

