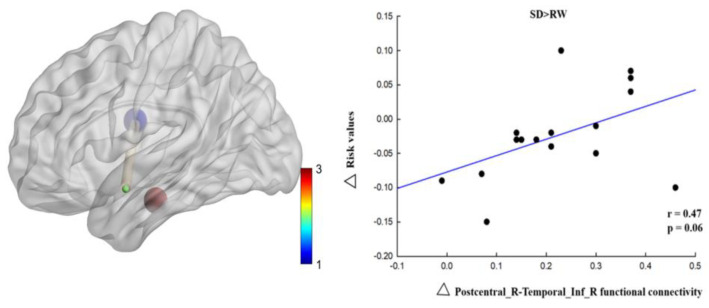
Figure 6.
Functional connectivity changes correlated with risk value changes following sleep deprivation. Scatter plots show the relationship between right postcentral and right inferior temporal functional connectivity changes and risk value changes following sleep deprivation. Corresponding functional connectivity is illustrated to the left, beside each scatter plot, in which blue represents right postcentral (69, −6, 21), red represents right inferior temporal (48, −18, −21) and green represents left middle temporal (−51, 0, −15). SD, sleep deprivation; RW, rested wakefulness; R, right; Inf, inferior.

