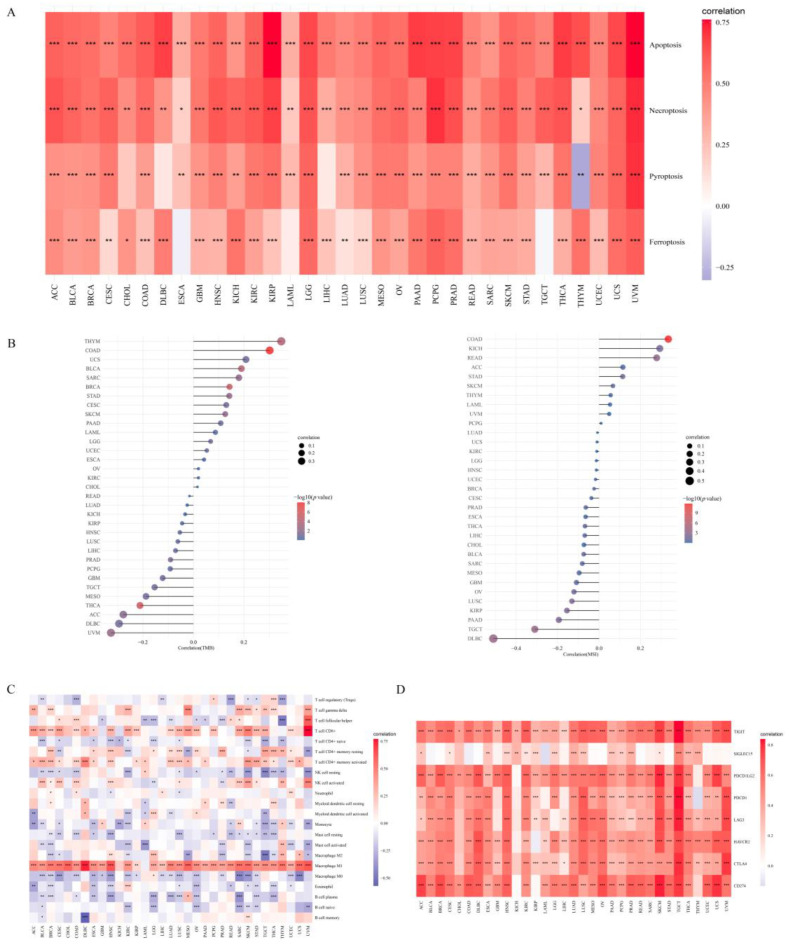
Figure 3.
Association of APOL6 levels with cell death burden, immune cell inflation, immune checkpoints, tumor mutation burden (TMB) and microsatellite instability (MSI). (A,C,D) Heatmap of the cell death score, CIBERSORT immune score, immune checkpoint-related gene expression and APOL6 expression in multiple tumor tissues. Each box in the figure represents the Spearman correlation analysis between the APOL6 expression and cell death score, CIBERSORT immune score and immune checkpoint-related gene expression in corresponding tumors. (B) Spearman correlation analysis of TMB, MSI and APOL6 gene expression. * p < 0.05, ** p < 0.01, *** p < 0.001.

