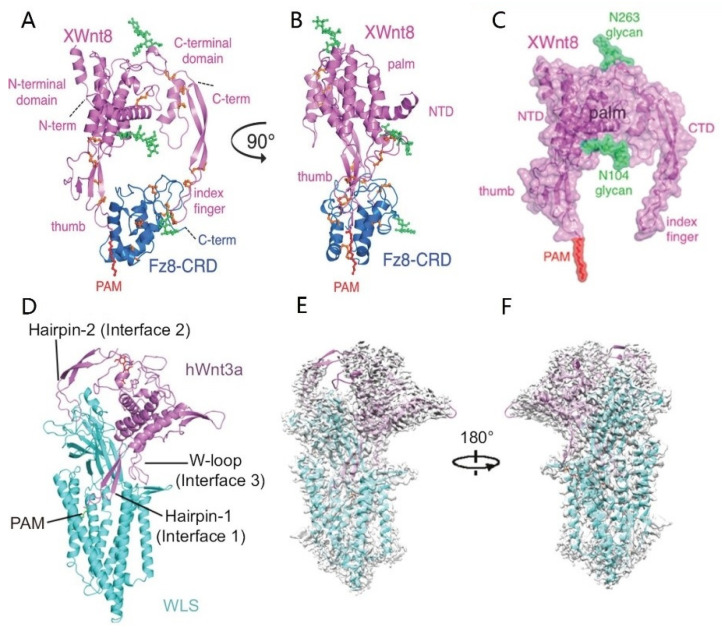
Figure 2.
Overall structures of the XWnt8/Fz8-CRD complex (A–C) [114] and the Wnt3a/WLS complex (D–F) [115]. The structure is shown in a cartoon with XWnt8 and Wnt3a colored in violet, Fz8-CRD colored in blue, and WLS colored in cyan. (A) The spatial structure of XWnt8/Fz8-CRD complex as viewed ‘face on’. (B) The spatial structure of the XWnt8/Fz8-CRD complex as viewed ‘side-on’. (C) The structure of XWnt8 after moving Fz8-CRD from the complex. (D) The spatial structure of the tWnt3a/WLS complex. (E) Fit of the WLS/Wnt3a complex model with the cryo-EM map. (F) The other side of the fitting panel E after 180 degrees rotation.

