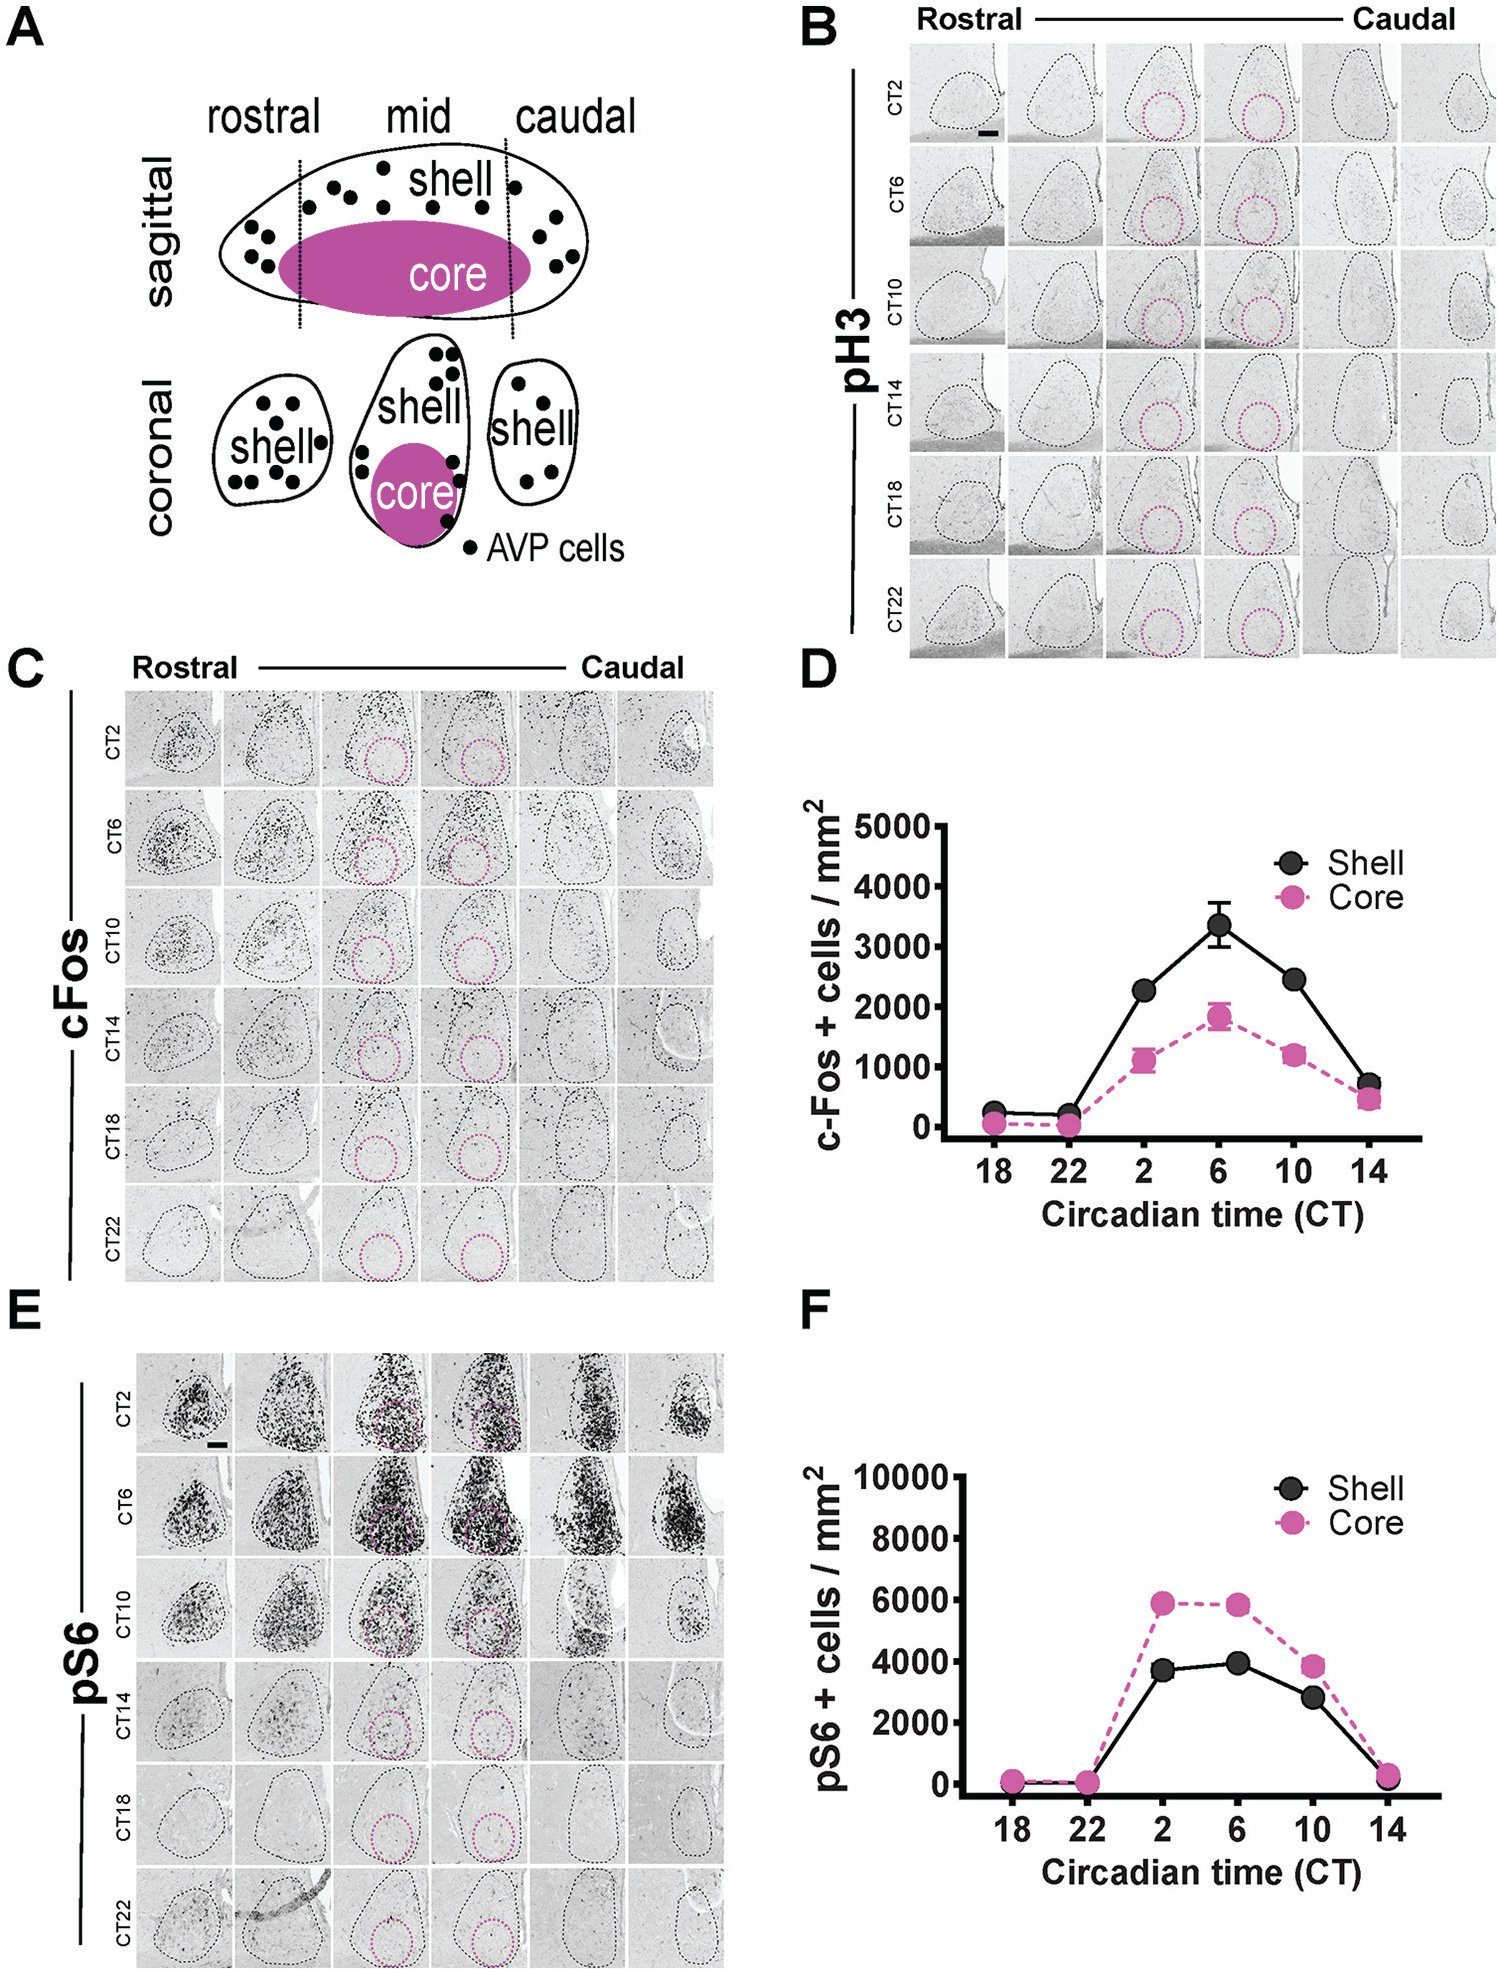
Figure 1.

Circadian analyses of pH3, cFos, and pS6 expression in the SCN. Delineation of the SCN into core and shell (A). Circadian expression of pH3 (B), cFos (C), and pS6 (E) in the SCN is outlined by the black dotted line, with the magenta circles showing the approximate core region. Quantification of the rhythms as mean ± SEM for cFos (D) row factor (circadian time), F5,24 = 97.98, p < 0.0001; column factor (core vs. shell), F5,24 = 80.44, p < 0.0001. Quantification of the rhythms as mean ± SEM for pS6 (F) row factor (circadian time), F5,24 = 1040, p < 0.0001; column factor (core vs. shell), F5,24 = 212.7, p < 0.0001. n = 3 mice per time point (24 animals total for both D and F). Some error bars are not visible because they are within the symbol in the plot. Scale bar: 94 μm.
