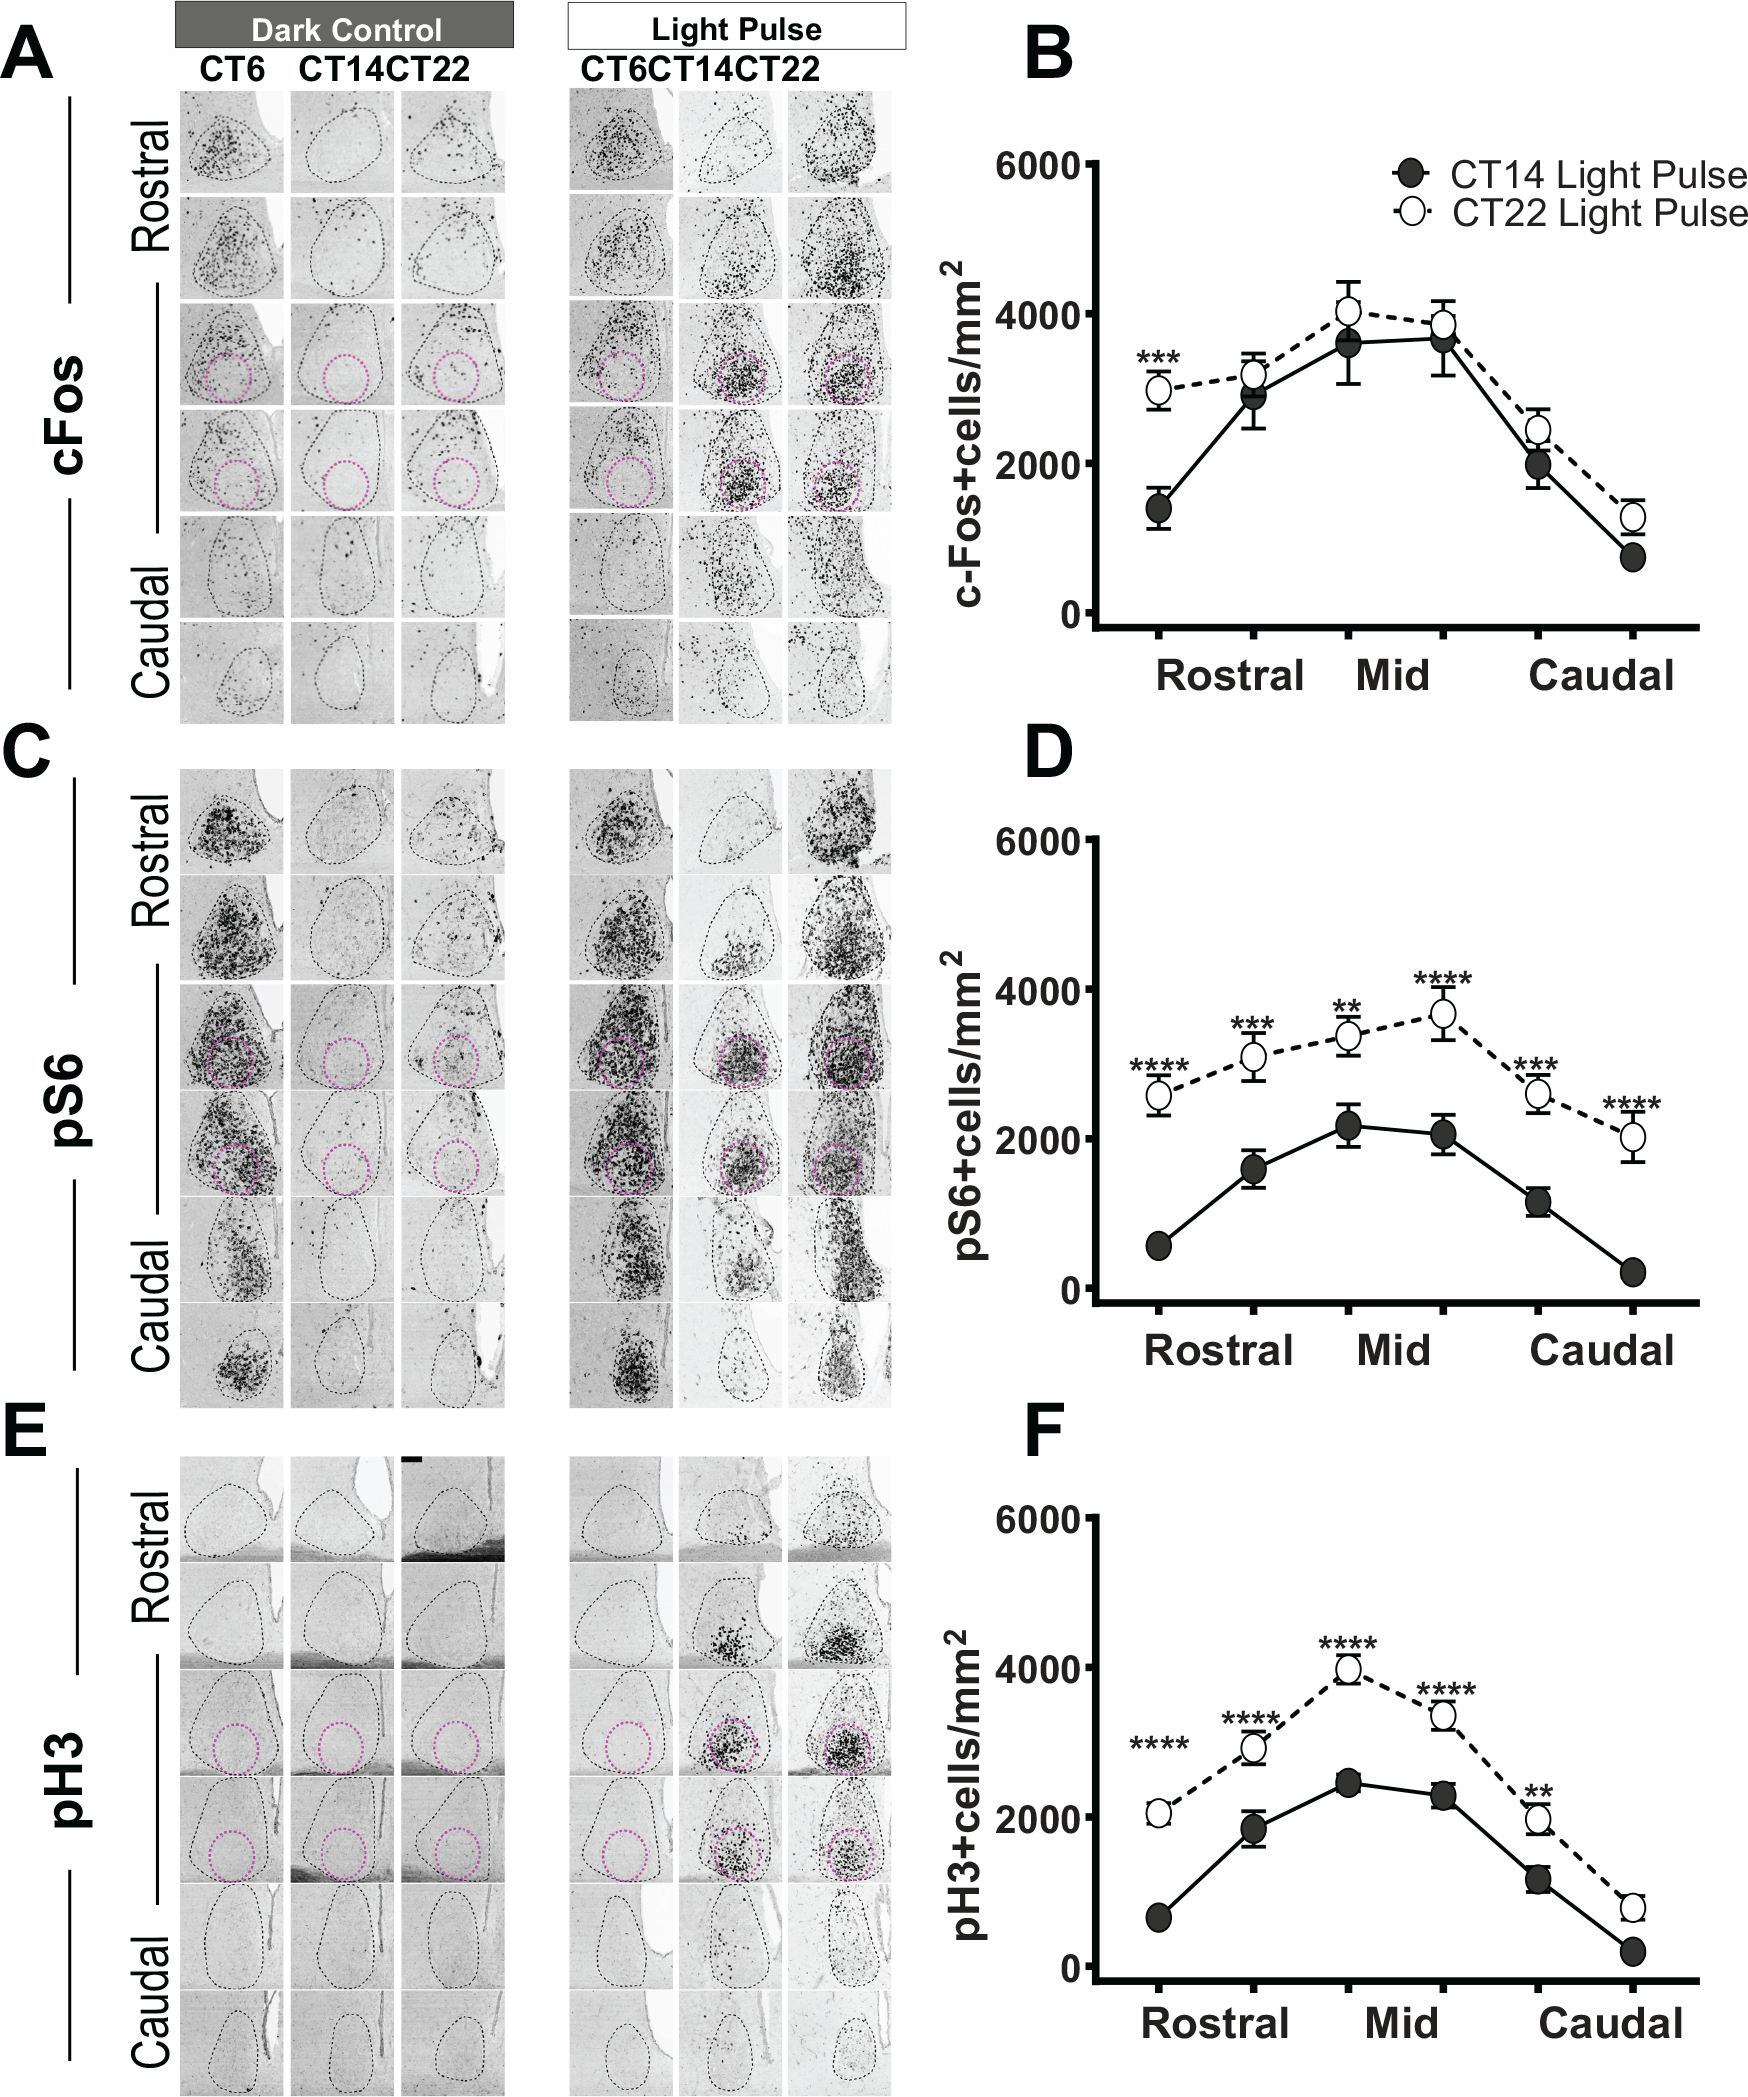
Figure 2.

Light-induced effects on cFos, pS6, and pH3 expression in the SCN. cFos (A), pS6 (C), and pH3 (E) expression in the SCN in darkness and following light pulses at CT6, CT14, or CT22. SCN is defined as in Figure 1. Quantification of cFos+ (B), pS6 (D), and ph3 (F) cell density (defined as the number of positive cells/area in mm2) throughout the rostral-caudal levels of the SCN after light at CT14 (n = 7–9, each marker) or CT22 (n = 7–9, each marker). cFos (B) row factor (rostral to caudal), F5,72 = 31.86, p < 0.0001; column factor (CT14 light pulse vs. CT22 light pulse), F1,72 = 13.50, p = 0.0005. pS6 (D) row factor (rostral to caudal), F5,72 = 16.14, p < 0.0001; column factor (CT14 light pulse vs. CT22 light pulse), F1,72 = 129.2, p < 0.0001. pH3 (F) row factor (rostral to caudal), F5,96 = 74.81, p < 0.0001; column factor (CT14 light pulse vs. CT22 light pulse), F11,96 = 125.6, p < 0.0001, 2-way analysis of variance. The asterisk (*) on the graph represents the difference between CT14 light pulse versus CT22 light pulse. Scale bar: 94 μm.
