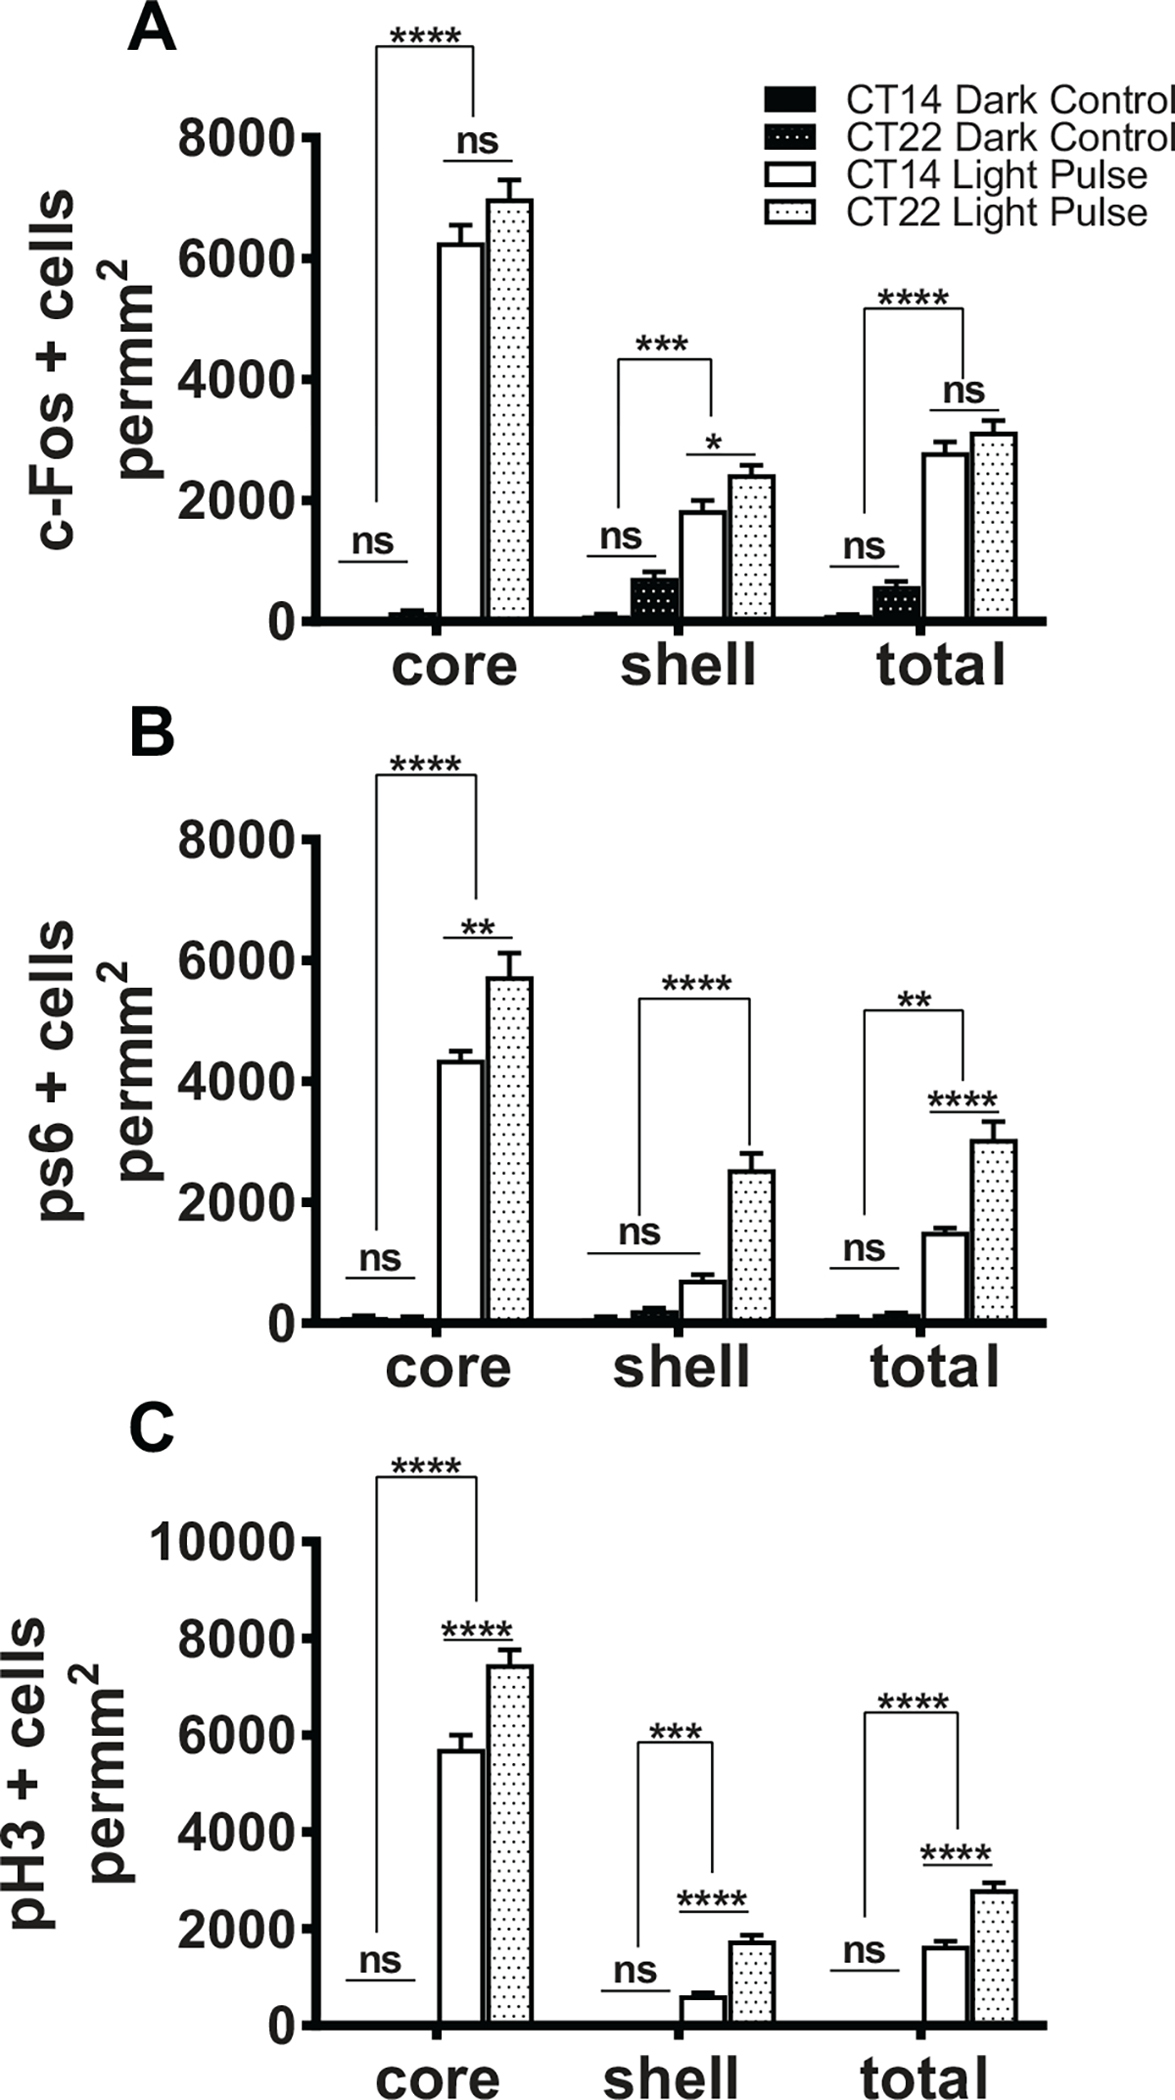
Figure 3.

Molecular changes during phase delays versus phase advances. Quantification of cFos+ cell density in the SCN core and shell in dark control (n = 7, each CT) and after a 15-min light pulse (n = 7, each CT) at CT14 or CT22 (a). ****p < 0.0001, 1-way analysis of variance (ANOVA), post hoc by Bonferroni’s multiple comparisons test; ns indicates p > 0.05. Quantification of pS6+ cell density in the SCN core and shell in dark control (n = 7, each CT) and after a 15-min light pulse (n = 7, each CT) at CT14 or CT22 (B). ****p < 0.0001; ns indicates p > 0.05, 1-way ANOVA. Quantification of pH3+ cell density in the SCN core and shell in dark control (n = 7, each CT) and after a 15-min light pulse (n = 9, each CT) at CT14 or CT22 (C). ****p < 0.0001; ns indicates p > 0.05, 1-way ANOVA.
