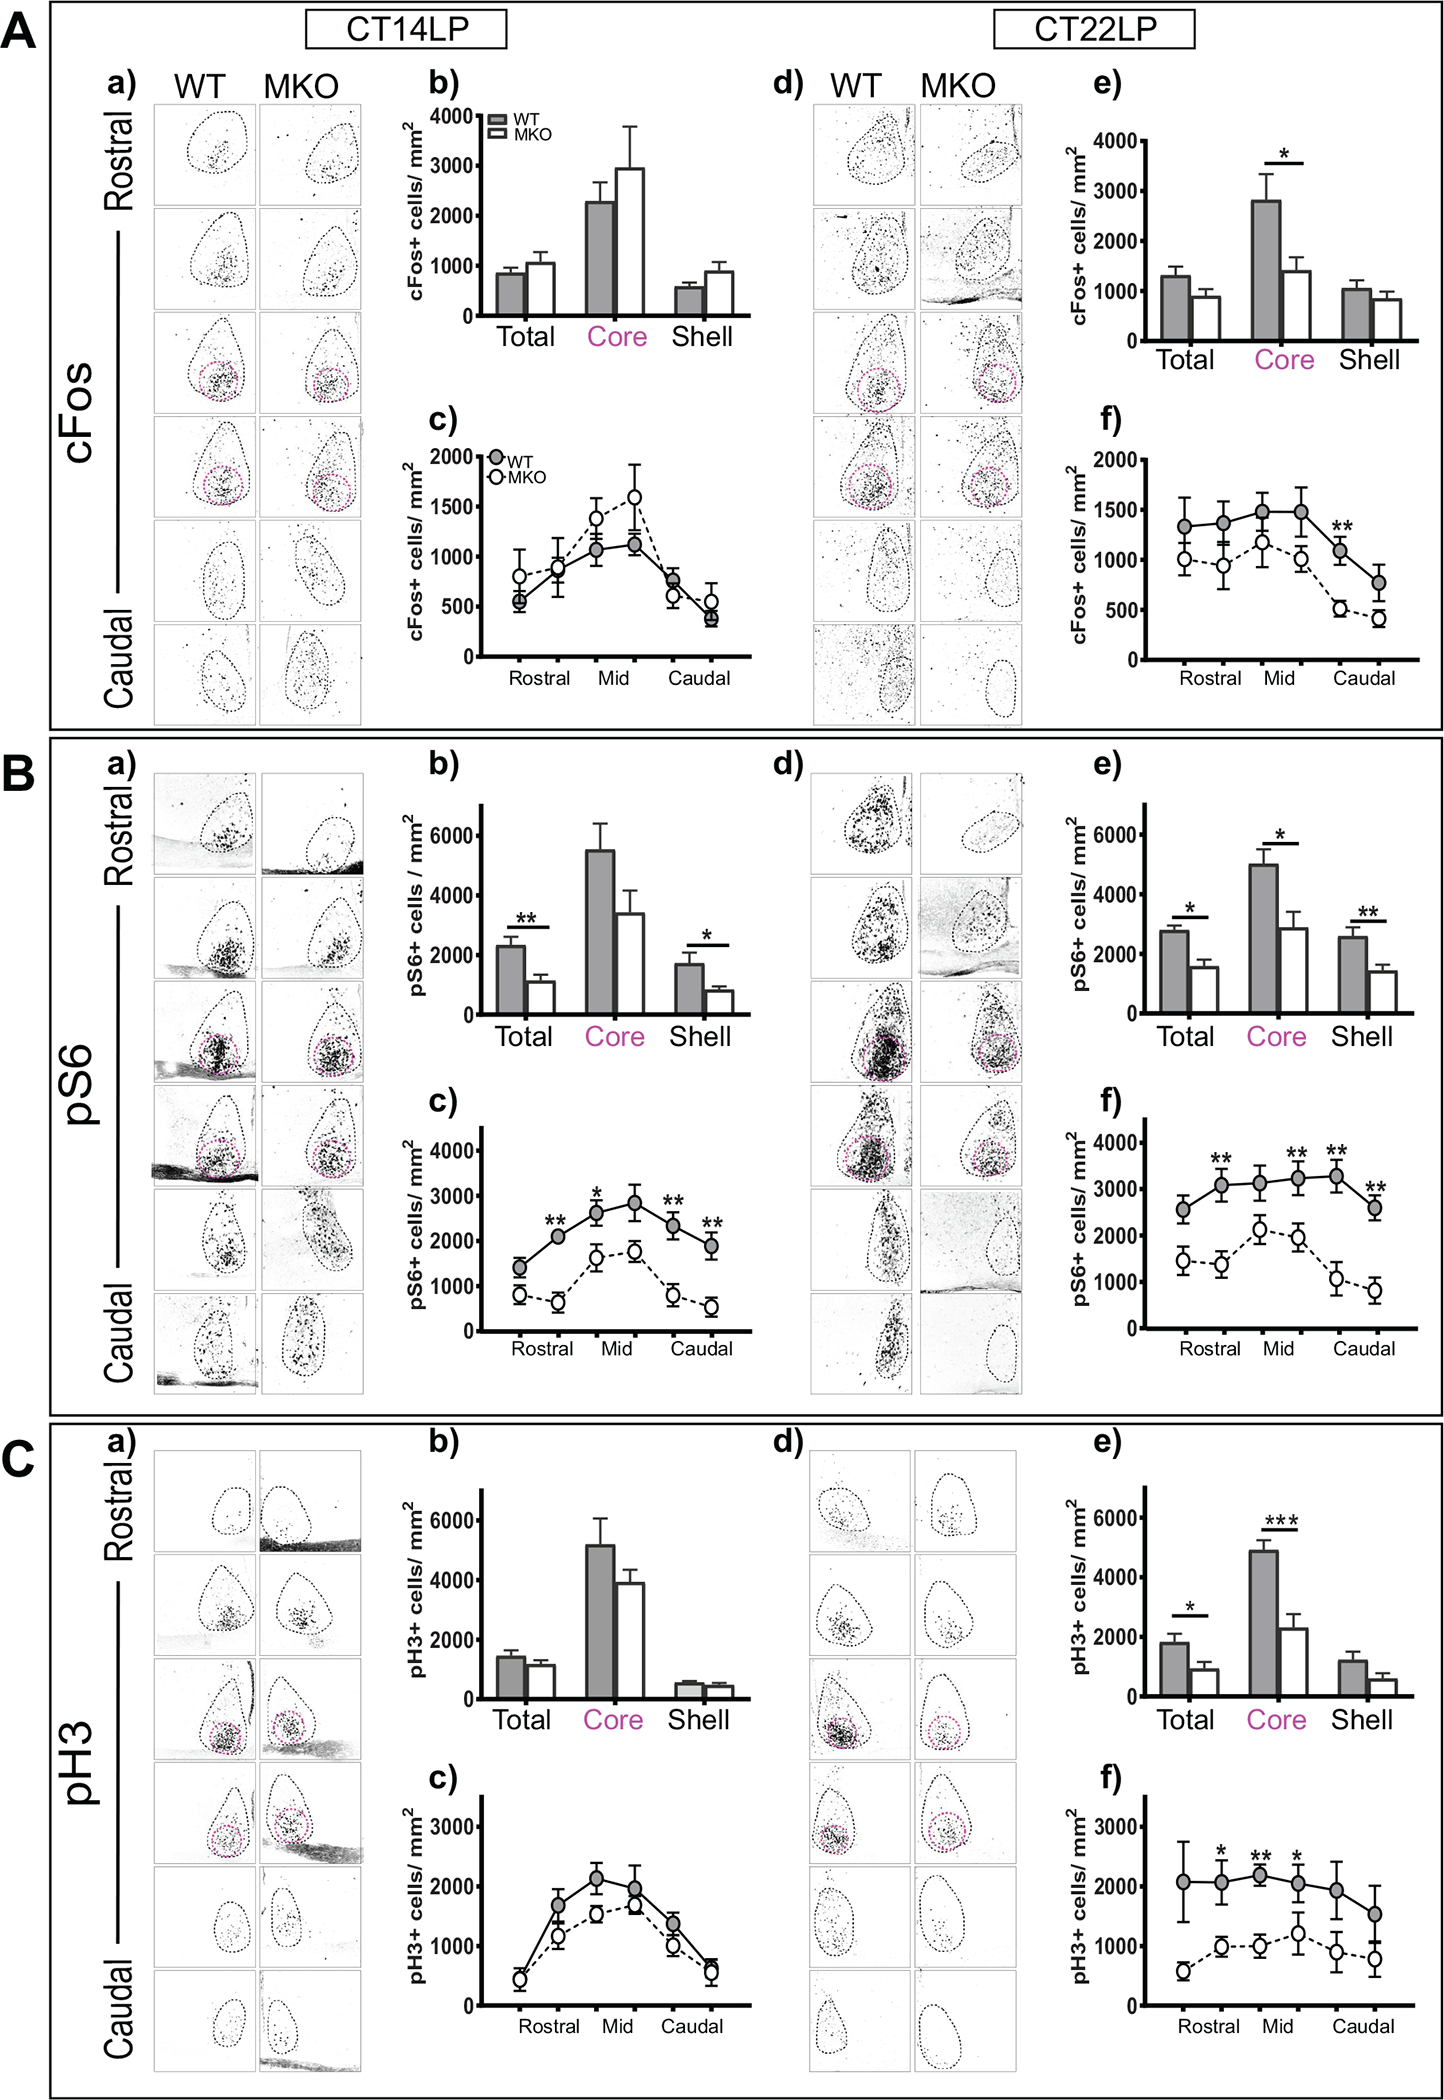
Figure 4.

Investigating the molecular changes in melanopsin knockout animals (MKOs). (a) SCN cFos expression following the light pulse at CT14. (b) Quantification of cFos+ cell density in the SCN core and shell after light at CT14. (c) Quantification of cFos+ cell density throughout rostral-caudal levels of the SCN after light at CT14. (d) SCN cFos expression following light pulse at CT22. (e) Quantification of cFos+ cell density in the SCN core and shell after light at CT22 (*p < 0.05, unpaired t test). (f) Quantification of cFos+ cell density throughout the rostral-caudal levels of the SCN after light at CT22 in MKos (n = 6–7) and wild-type (WT) littermates (n = 6). Row factor (rostral to caudal), F5,66 = 4.439, p = 0.0015; column factor (WT vs. MKO), F1,66 = 15.78, p = 0.0002: 2-way analysis of variance (ANOVA) (A). (a) SCN pS6 expression following light pulse at CT14. (b) Quantification of pS6+ cell density in the SCN core and shell after light at CT14 (**p < 0.05, unpaired t test). (c) Quantification of pS6+ cell density throughout the rostral-caudal levels of the SCN after light at CT14. row factor (rostral to caudal), F5,54 = 6.514, p < 0.0001; column factor (WT vs. MKo), F1,54 = 47.66, p < 0.0001. Two-way ANOVA. (d) SCN pS6 expression following light pulse at CT22. (e) Quantification of pS6+ cell density in the SCN core and shell after light at CT22 (**p < 0.05, unpaired t test). (f) Quantification of pS6+ cell density throughout the rostral-caudal levels of the SCN after light at CT22 in MKos (n = 6–7) and WT littermates (n = 6). Row factor (rostral to caudal), F5,66 = 2.382, p = 0477; column factor (WT vs. MKO), F1,66 = 65.93, p < 0.0001, 2-way ANOVA (B). (a) SCN pH3 expression following light pulse at CT14. (b) Quantification of pH3+ cell density in the SCN core and shell after light at CT14. (c) Quantification of pH3+ cell density throughout the rostral-caudal levels of the SCN after light at CT14. (d) SCN pH3 expression following light pulse at CT22. (e) Quantification of pH3+ cell density in the SCN core and shell after light at CT22 (***p < 0.05 unpaired t test). (f) Quantification of pH3+ cell density throughout the rostral-caudal levels of the SCN after light at CT22 in MKOs (n = 7) and WT littermates (n = 7). row factor (rostral to caudal), F5,66 = 4.469, p = 00014; column factor (WT vs. MKO), F1,66 = 37.03, p < 0.0001, 2-way ANOVA (C). The asterisk (*) on the graph represents the difference between WT and MKO. Scale bar: 94 μm.
