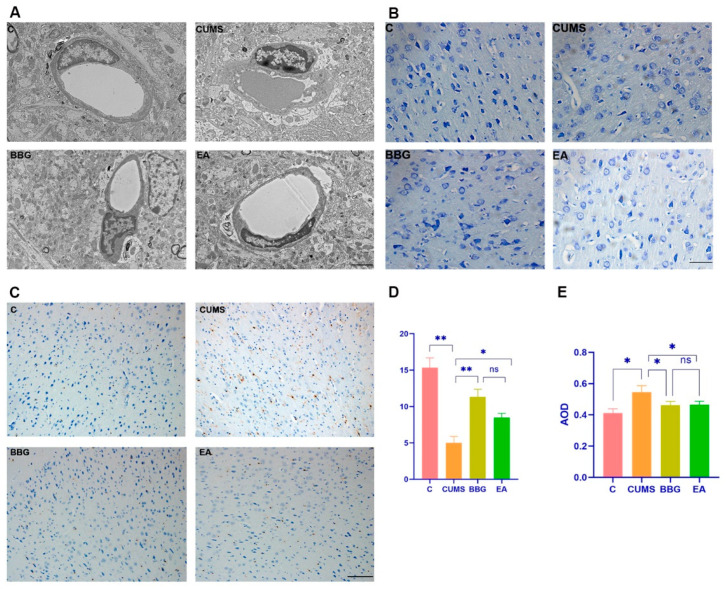
Figure 2.
Effects of EA on the PFC: (A) microglial morphology, (B) Nissl bodies, and (C) comparison of Iba1 expression in PFC. Nissl body count of PFC of rats in each group (D), comparison of Iba1 expression in PFC in each group (E). * p < 0.05, ** p < 0.01. The scale bars in A = 2 μm, the scale bar in B = 50 μm, the scale bar in C = 100 μm.

