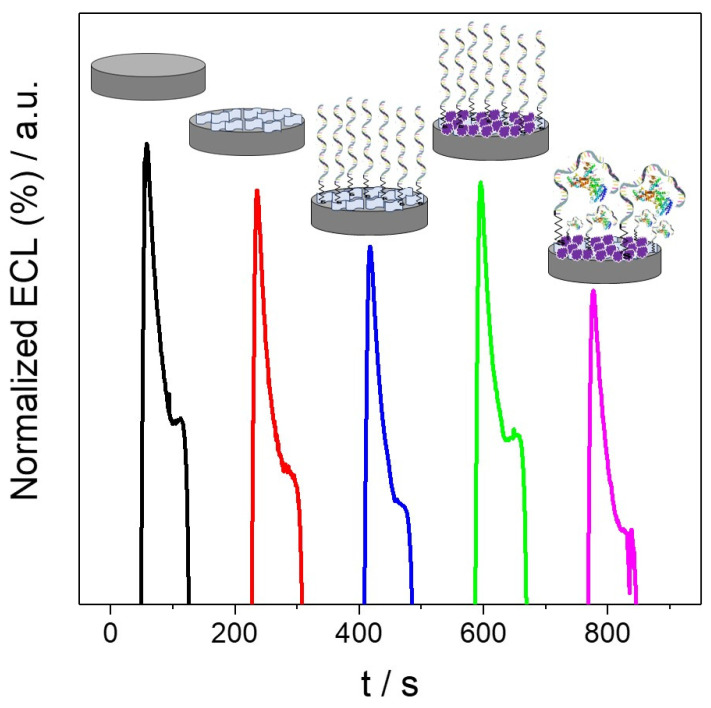
Figure 6.
ECL signals of CSPE (black curve), CSPE/MoS2-NS (red curve), CSPE/MoS2-NS/Apt-SH (blue curve), CSPE/MoS2-NS/Apt-SH/BSA (green curve) and CSPE/MoS2-NS/Apt-SH/BSA/HER2 (purple curve; HER2 tested concentration was 13.7 pg/mL) using a solution of 7 mM [Ru(bpy)3]2+ and 8 mg/mL CDs in 0.2 M PB pH 8. Cyclic potential scan from 0.50 V to 1.40 V and 10 mV/s of scan rate.

