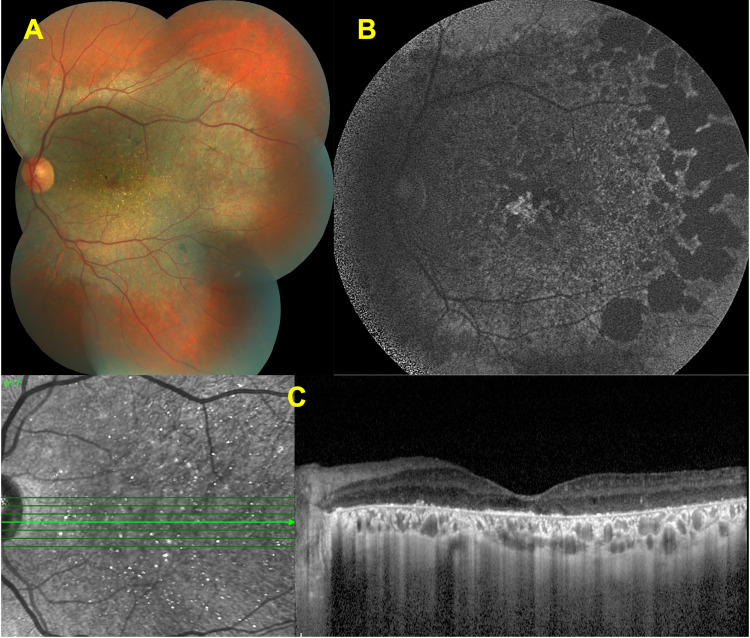
Figure 4.
Features of intermediate disease stage. Color fundus image of a left eye (A) showing the chorioretinal atrophy extending from the posterior pole and glistening crystals at the macula. Fundus autofluorescence image (B) revealing the well-demarcated hypofluorescent patches corresponding to the atrophy. Spectral domain-optical coherence tomography (SD-OCT) section (C) demonstrating the hyperreflective deposits at the RPE – Bruch’s membrane complex, together with the disruption and loss of the EZ band.

