Figure 1.
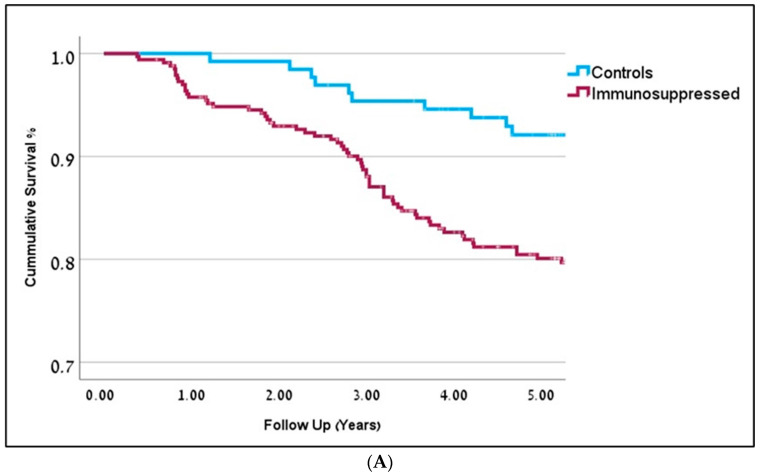
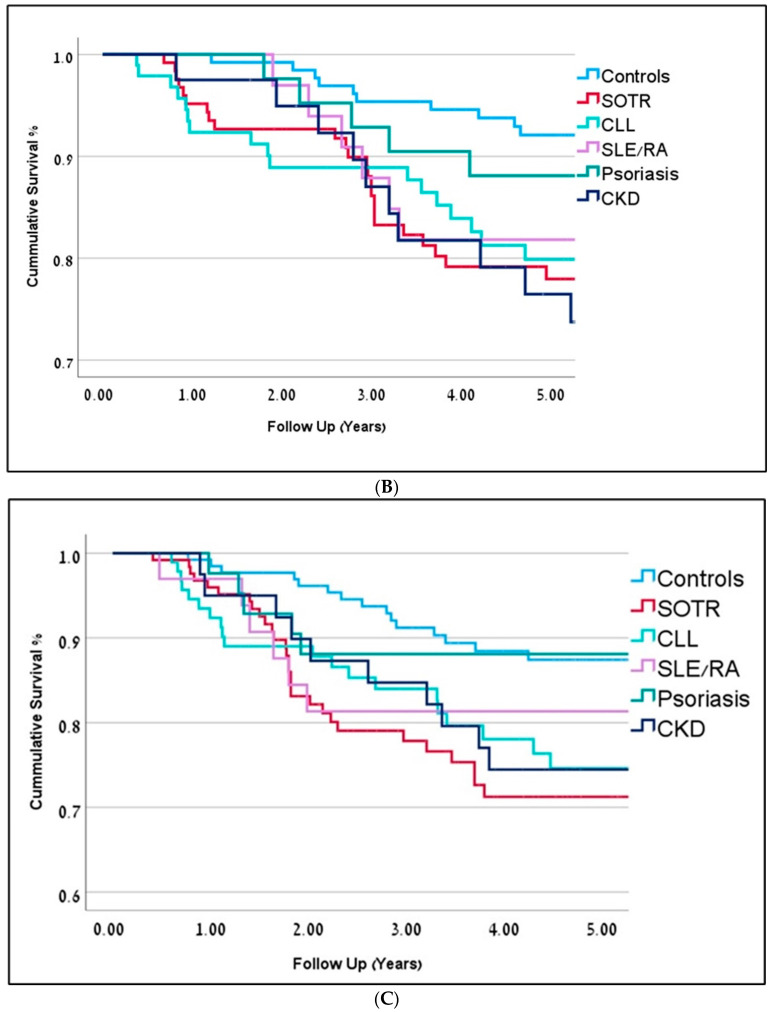
(A) Kaplan-Meier curves representing 5-year overall survival for immunosuppressed patients are in dark red (OR-0.81) and controls are in blue (OR = 0.91). Follow-up is represented in years (p = 0.001). (B) Kaplan-Meier curves representing 5-year overall survival (in years) for the different immunosuppression groups. Solid Organ Transplant Recipients (SOTR) in red; Chronic Lym-phocytic Leukemia (CLL) in bright green; Chronic Kidney Disease (CKD) in dark blue; Rheumatic Arthritis (RA) and Systemic Lupus Erythematosus (SLE) in purple; Psoriasis in green; Controls in blue. (C) Kaplan-Meier curves representing 5-year disease-free survival (in years) for the different immunosuppression groups. Solid Organ Transplant Recipients (SOTR) in red; Chronic Lym-phocytic Leukemia (CLL) in bright green; Chronic Kidney Disease (CKD) in dark blue; Rheumatic Arthritis (RA) and Systemic Lupus Erythematosus (SLE) in purple; Psoriasis in green; Controls in blue.


