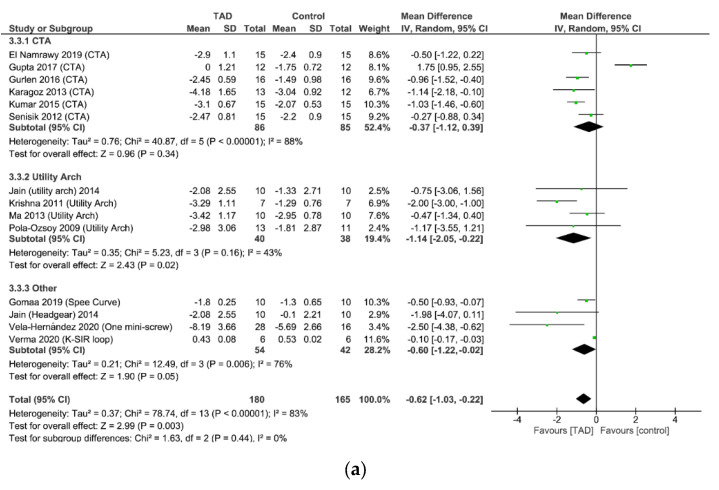
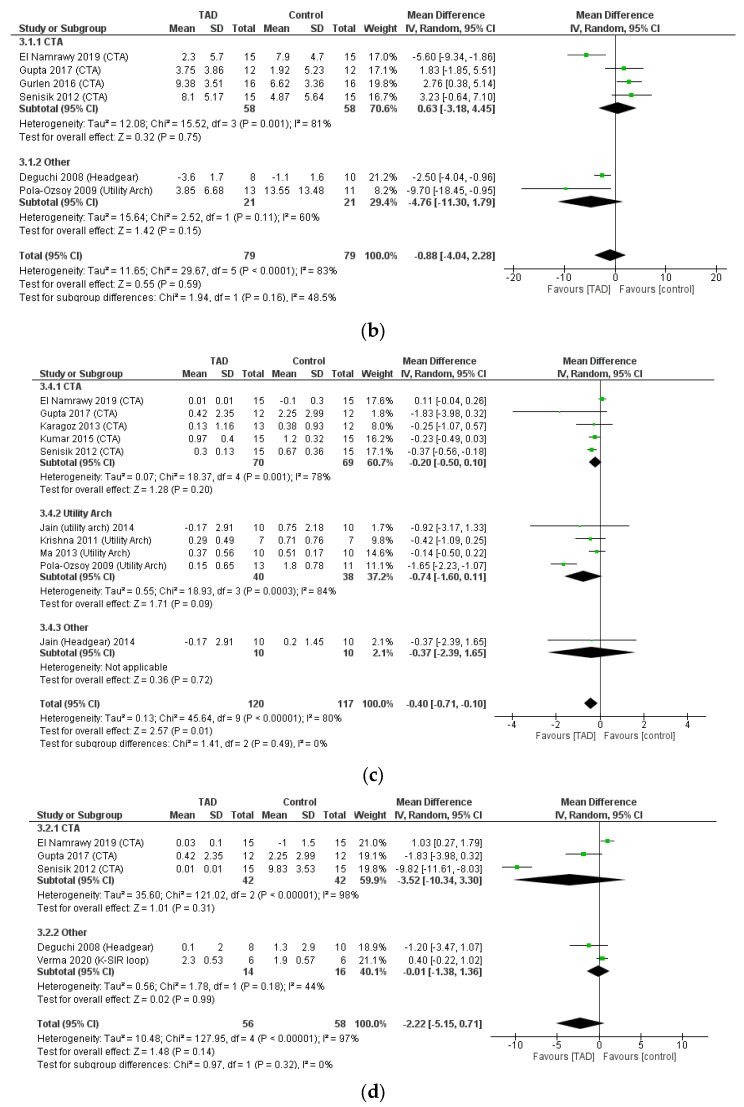
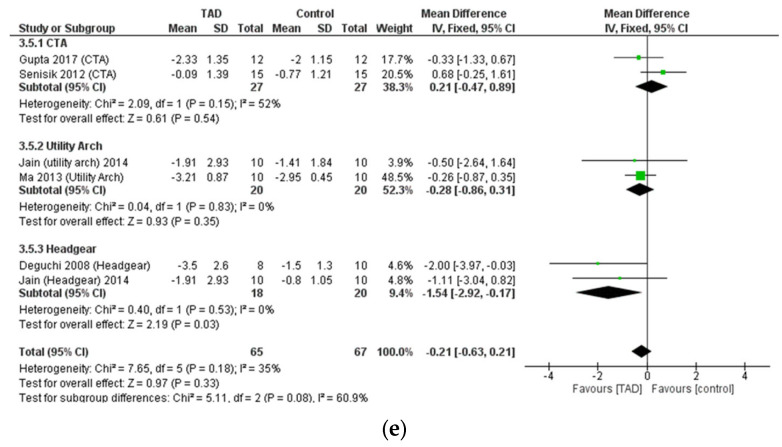
Figure 9.
(a). Forrest plot for random-effects analysis of differences in U1-PP distance. (b) Forrest plot for random-effects analysis of differences in a. U1-PP angle. (c) Forrest plot for random-effects analysis of differences in a. U6-PP distance. (d) Forrest plot for random-effects analysis of differences in a. U6-PP angle. (e) Forrest plot for random-effects analysis of differences in a. U1-stm distance.


