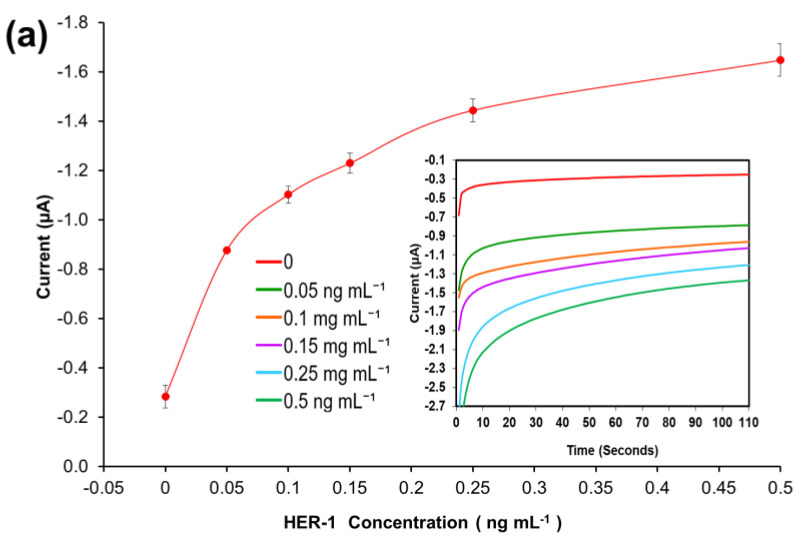
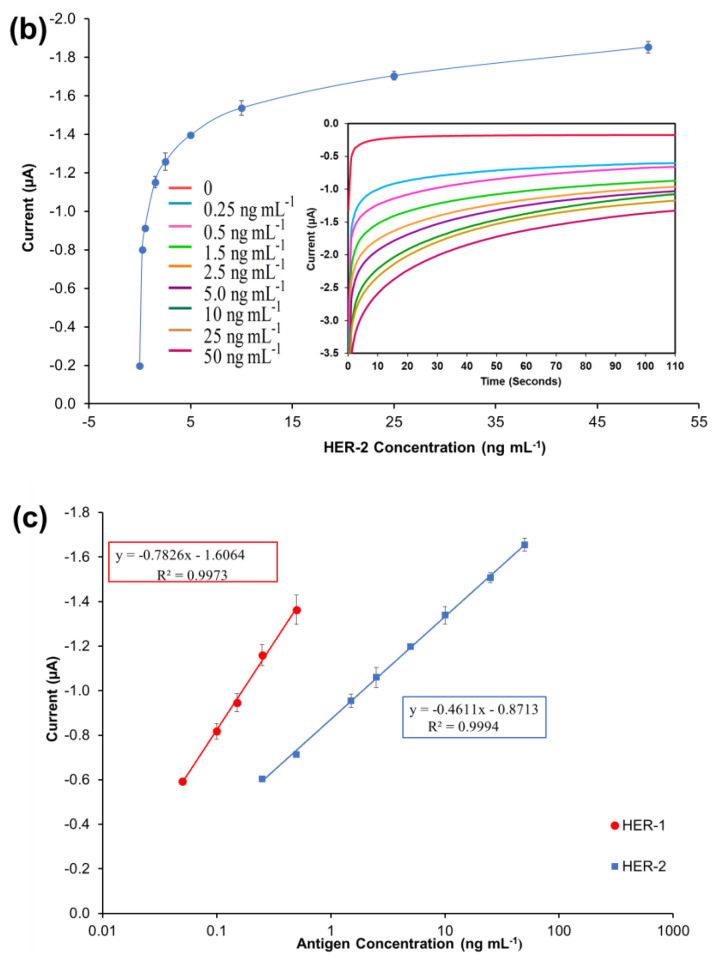
Figure 4.
Biosensor response of the optimized immunoassay performed using AuNP-Ab-HRP conjugates against various concentrations of; (a) HER-1 antigen (0–0.5 ng mL−1) and (b) HER-2 antigen (0–50 ng mL−1). The embedded graphs show the raw data reading obtained from the chronoamperometry measurements. (c) Linear regression curves for HER-1 and HER-2 AuNP-Ab-HRP conjugate assay, obtained with data taken from Figure 4a,b. Standard deviations were calculated for experiments performed in triplicates (n = 3).


