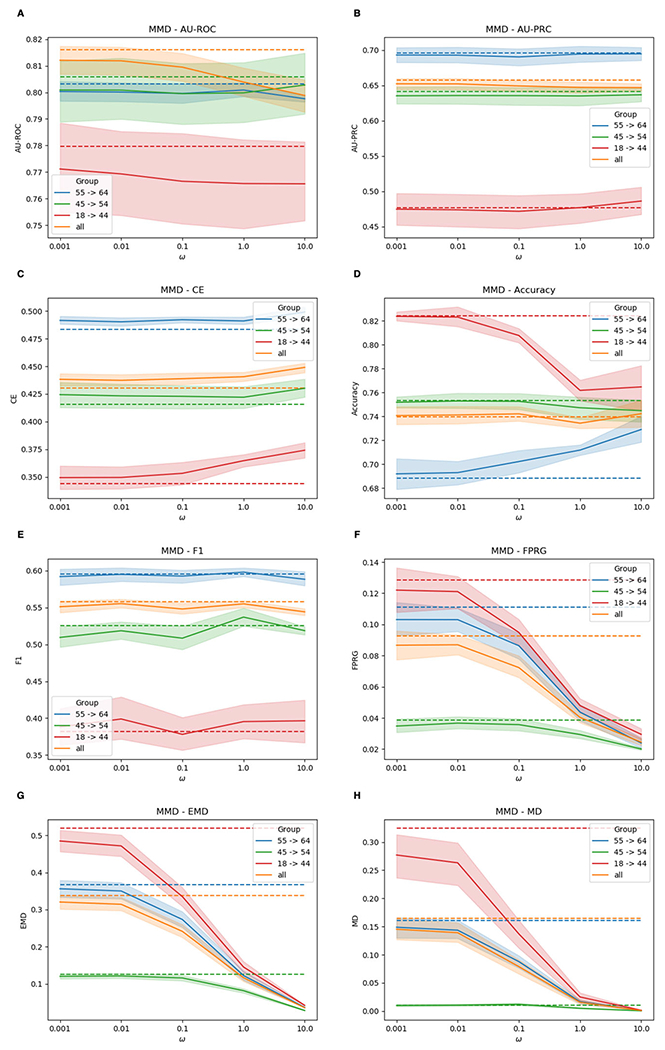
Fig. 6.

Performances of F-MuViTaNet (using MMD to enforce fairness) for cardiac complication risk profiling with respect to accuracy (i.e., AUROC (↑), AU-PRC (↑), CE (↓), Accuracy (↑), F1 (↑)) and fairness (FPRG (↓), EMD (↓), MD (↓)) metrics. The arrows show the direction to optimum scores for these metrics. Performances of baseline method (MuViTaNet) are shown by dash lines. The shade areas represents standard deviation ranges of scores calculated from cross-validation setting
