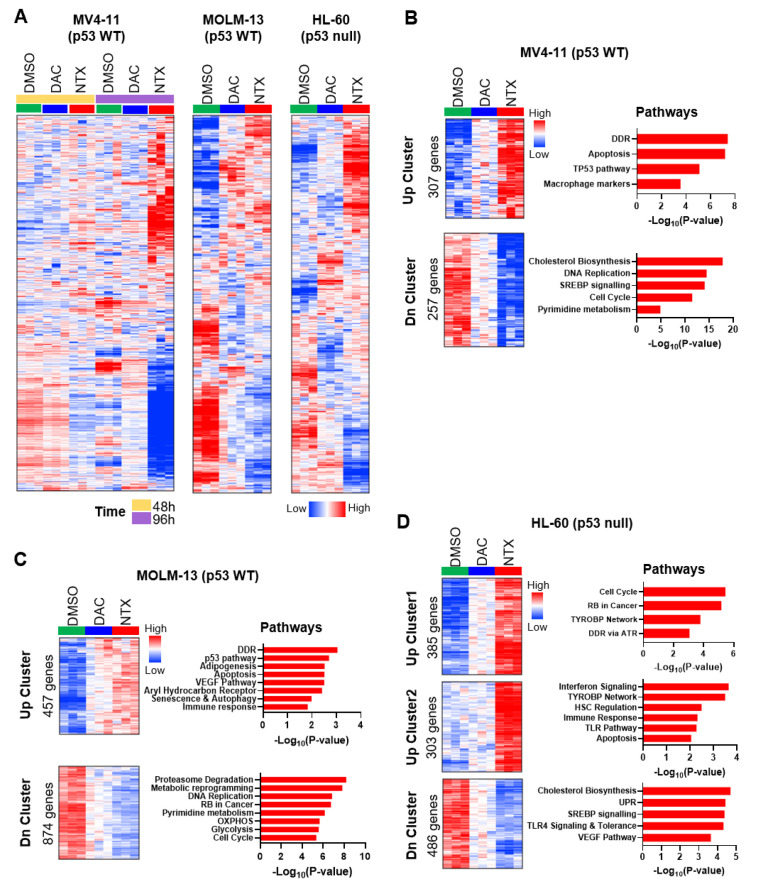
Figure 4.
Transcriptome analysis revealed the MoA of NTX-301. (A), Heatmaps displaying global changes in the transcriptomes of MV4-11, MOLM-13, and HL-60 cells after treatment with DMSO, NTX-301, or DAC (60 nM for MV4-11, 30 nM for HL-60, and 15 nM for MOLM-13). (B–D), Heatmaps showing gene sets that were more strongly up- (Up Cluster) or downregulated (Dn Cluster) by NTX-301 than by DAC and bar plots showing biological pathways associated with each gene set in MV4-11 (B), MOLM-13 (C), and HL-60 (D) cells. (B–D) are updated figures of Supplementary Figure S5B, previously published in [12].

