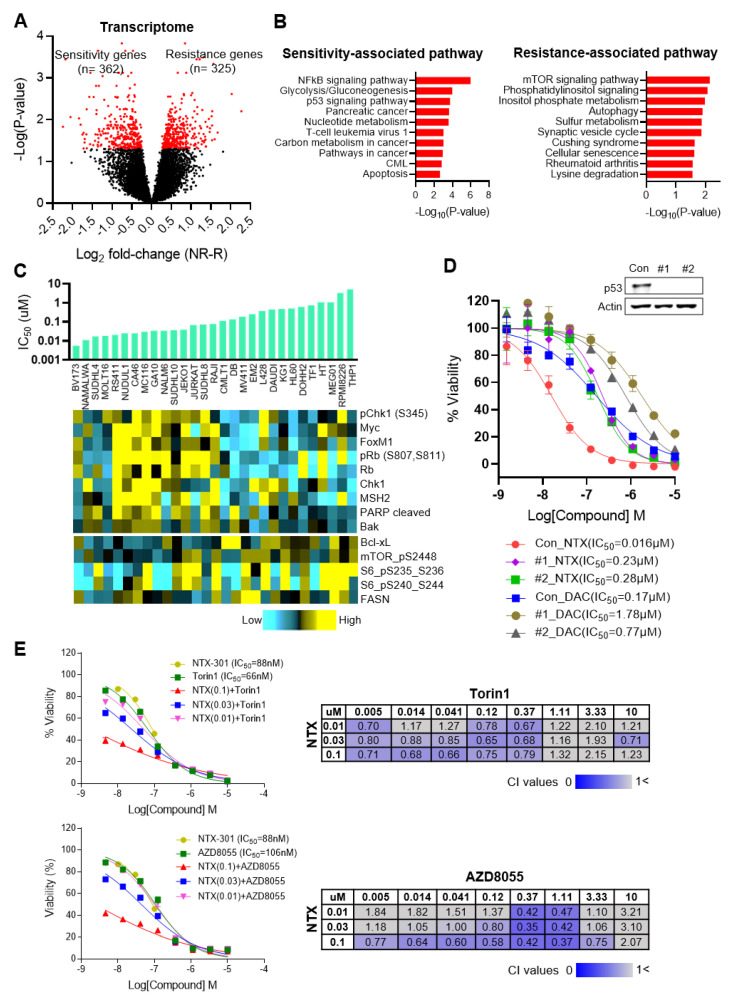
Figure 5.
Integrative analyses using 199 CCLs identified transcriptional events that are associated with sensitivity to NTX-301. (A), A volcano plot showing transcriptional events that are associated with sensitivity to NTX-301. On the X-axis, ‘log2 fold-change(NR-R)’ indicates the log2-transformed fold change in the expression of each gene in the nonresponders (NR) relative to the responders (R). The red dots highlight significant events that were identified by the cutoff criteria of p < 0.05. (B), Bar plots showing biological pathways that are significantly associated with sensitivity or resistance to NTX-301 at the transcriptome level. (C), Image integrating IC50 values upon NTX-301 treatment (bar plot) and protein expression levels from the Cancer Cell Line Encyclopedia (CCLE) RPPA data (heatmap) in 29 blood CCLs. (D), Dose–response curves of MV4-11 parental (con) and p53-KO cell lines (#1, #2) after treatment with NTX-301 or DAC for 3 days. p53 KO was confirmed by western blotting. (E), IC50 curves of NTX-301 and the mTOR inhibitors Torin1 (top) and AZD-8055 (bottom), used as monotherapy or in combination (left). Matrices show the combination index (CI) values of NTX-301 + mTOR inhibitors at the indicated concentrations in MV4-11 cells (right). CI values < 1 indicate synergism (blue), and CI values > 1 indicate no synergism (gray).

