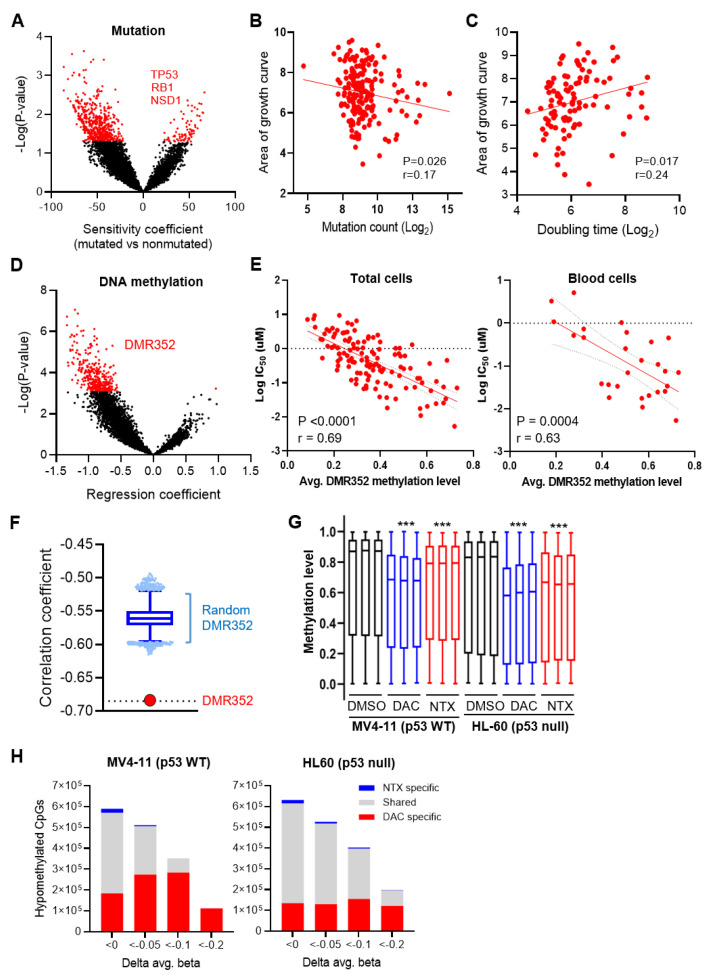
Figure 6.
Integrative analyses using 199 CCLs identified mutational and epigenomic events that are associated with sensitivity to NTX-301. (A), A volcano plot showing mutational events that are associated with sensitivity to NTX-301. On the X-axis, negative coefficient values indicate the skewing of each event toward the responders relative to the nonresponders. The red dots highlight significant events that were identified by the cutoff criteria of p < 0.05. (B,C), Scatter plots showing the log2-transformed mutation count (B) and doubling time (C) of CCLs plotted against the corresponding AUC values after NTX-301 treatment. (D), A volcano plot showing DNA methylation events that are associated with sensitivity to NTX-301. On the X-axis, negative coefficient values indicate the skewing of each event toward the responders relative to the nonresponders. The red dots highlight significant events (DMR352) that were identified by the cutoff criteria of a false discovery rate (FDR) < 0.05. (E), Scatter plots showing correlations between the average methylation level of DMR352 and the log-transformed IC50 value in all of the CCLs (left) and blood CCLs (right). p values and correlation coefficients (r) are shown. (F), Plot comparing correlation coefficients between the defined DMR352 and a random DMR352 (100,000 iterations of 352 randomly selected regions). (G), Box plots showing the distribution of levels of methylation (β-values) in 862,927 CpGs in triplicate samples of MV4-11 and HL-60 cells treated with NTX-301 or DAC (60 nM for MV4-11 and 30 nM for HL-60). ***, p < 0.0001. (H), Bar plots showing the number of demethylated CpGs among 862,927 CpGs in MV4-11 (left) and HL-60 (right) cells after treatment with NTX-301 or DAC. Demethylation was defined by the criteria of p < 0.05 and ∆β < 0, <−0.05, <−0.1, and <−0.2. ‘Shared’ indicates CpGs that were demethylated by both NTX-301 and DAC.

