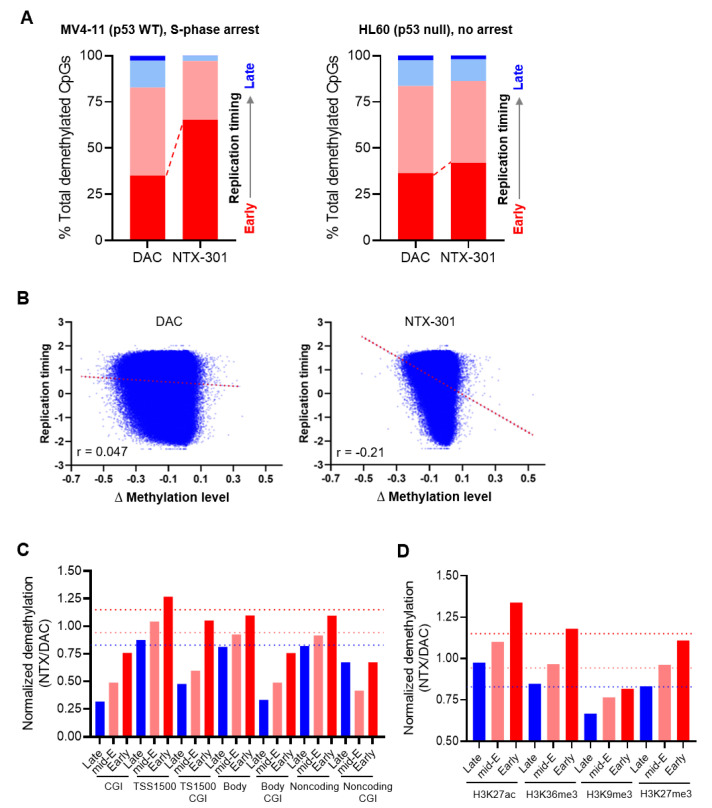
Figure 7.
NTX-301 promoted characteristic demethylation patterns. (A), Plots showing the distribution of CpGs that were demethylated after treatment with NTX-301 or DAC in four genomic regions annotated by replication timing from early (red) to late (blue) in MV4-11 (left) and HL-60 (right) cells. (B), Scatter plots showing differential methylation levels (∆methylation level = on-treatment level − basal level) plotted against replication timing in MV4-11 cells. Correlation coefficients (r) are shown. (C,D), Bar plots showing the normalized ratio of NTX-301-mediated demethylation to DAC-mediated demethylation in several genomic (C) and chromatin (D) features. The red, pink, and blue dotted lines denote the normalized baselines of the demethylation ratio in genomic regions with early, mid-early (mid-E), and late replication timing, respectively. CGI, CpG island; TSS1500, the region 1500 bp upstream of the transcription start site.

