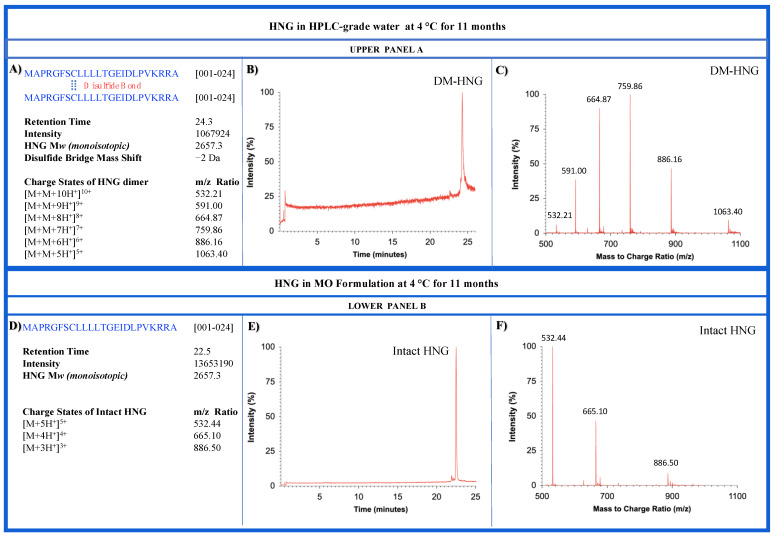
Figure 13.
Measurements of HNG in HPLC-grade water (Upper Panel A) and MO formulation (Lower Panel B) at 4 °C for 11 months using HRMS. UPPER PANEL A, (A) Amino acid sequence and m/z ratio of dimerized form HNG is represented; (B,C) Representative ion chromatogram and HRMS product ion mass spectra of HNG in HPLC water, respectively. LOWER PANEL B, (D) Amino acid sequence and m/z ratio of HNG is represented; (E,F) Representative ion chromatogram and HRMS product ion mass spectra of HNG in MO formulation.

