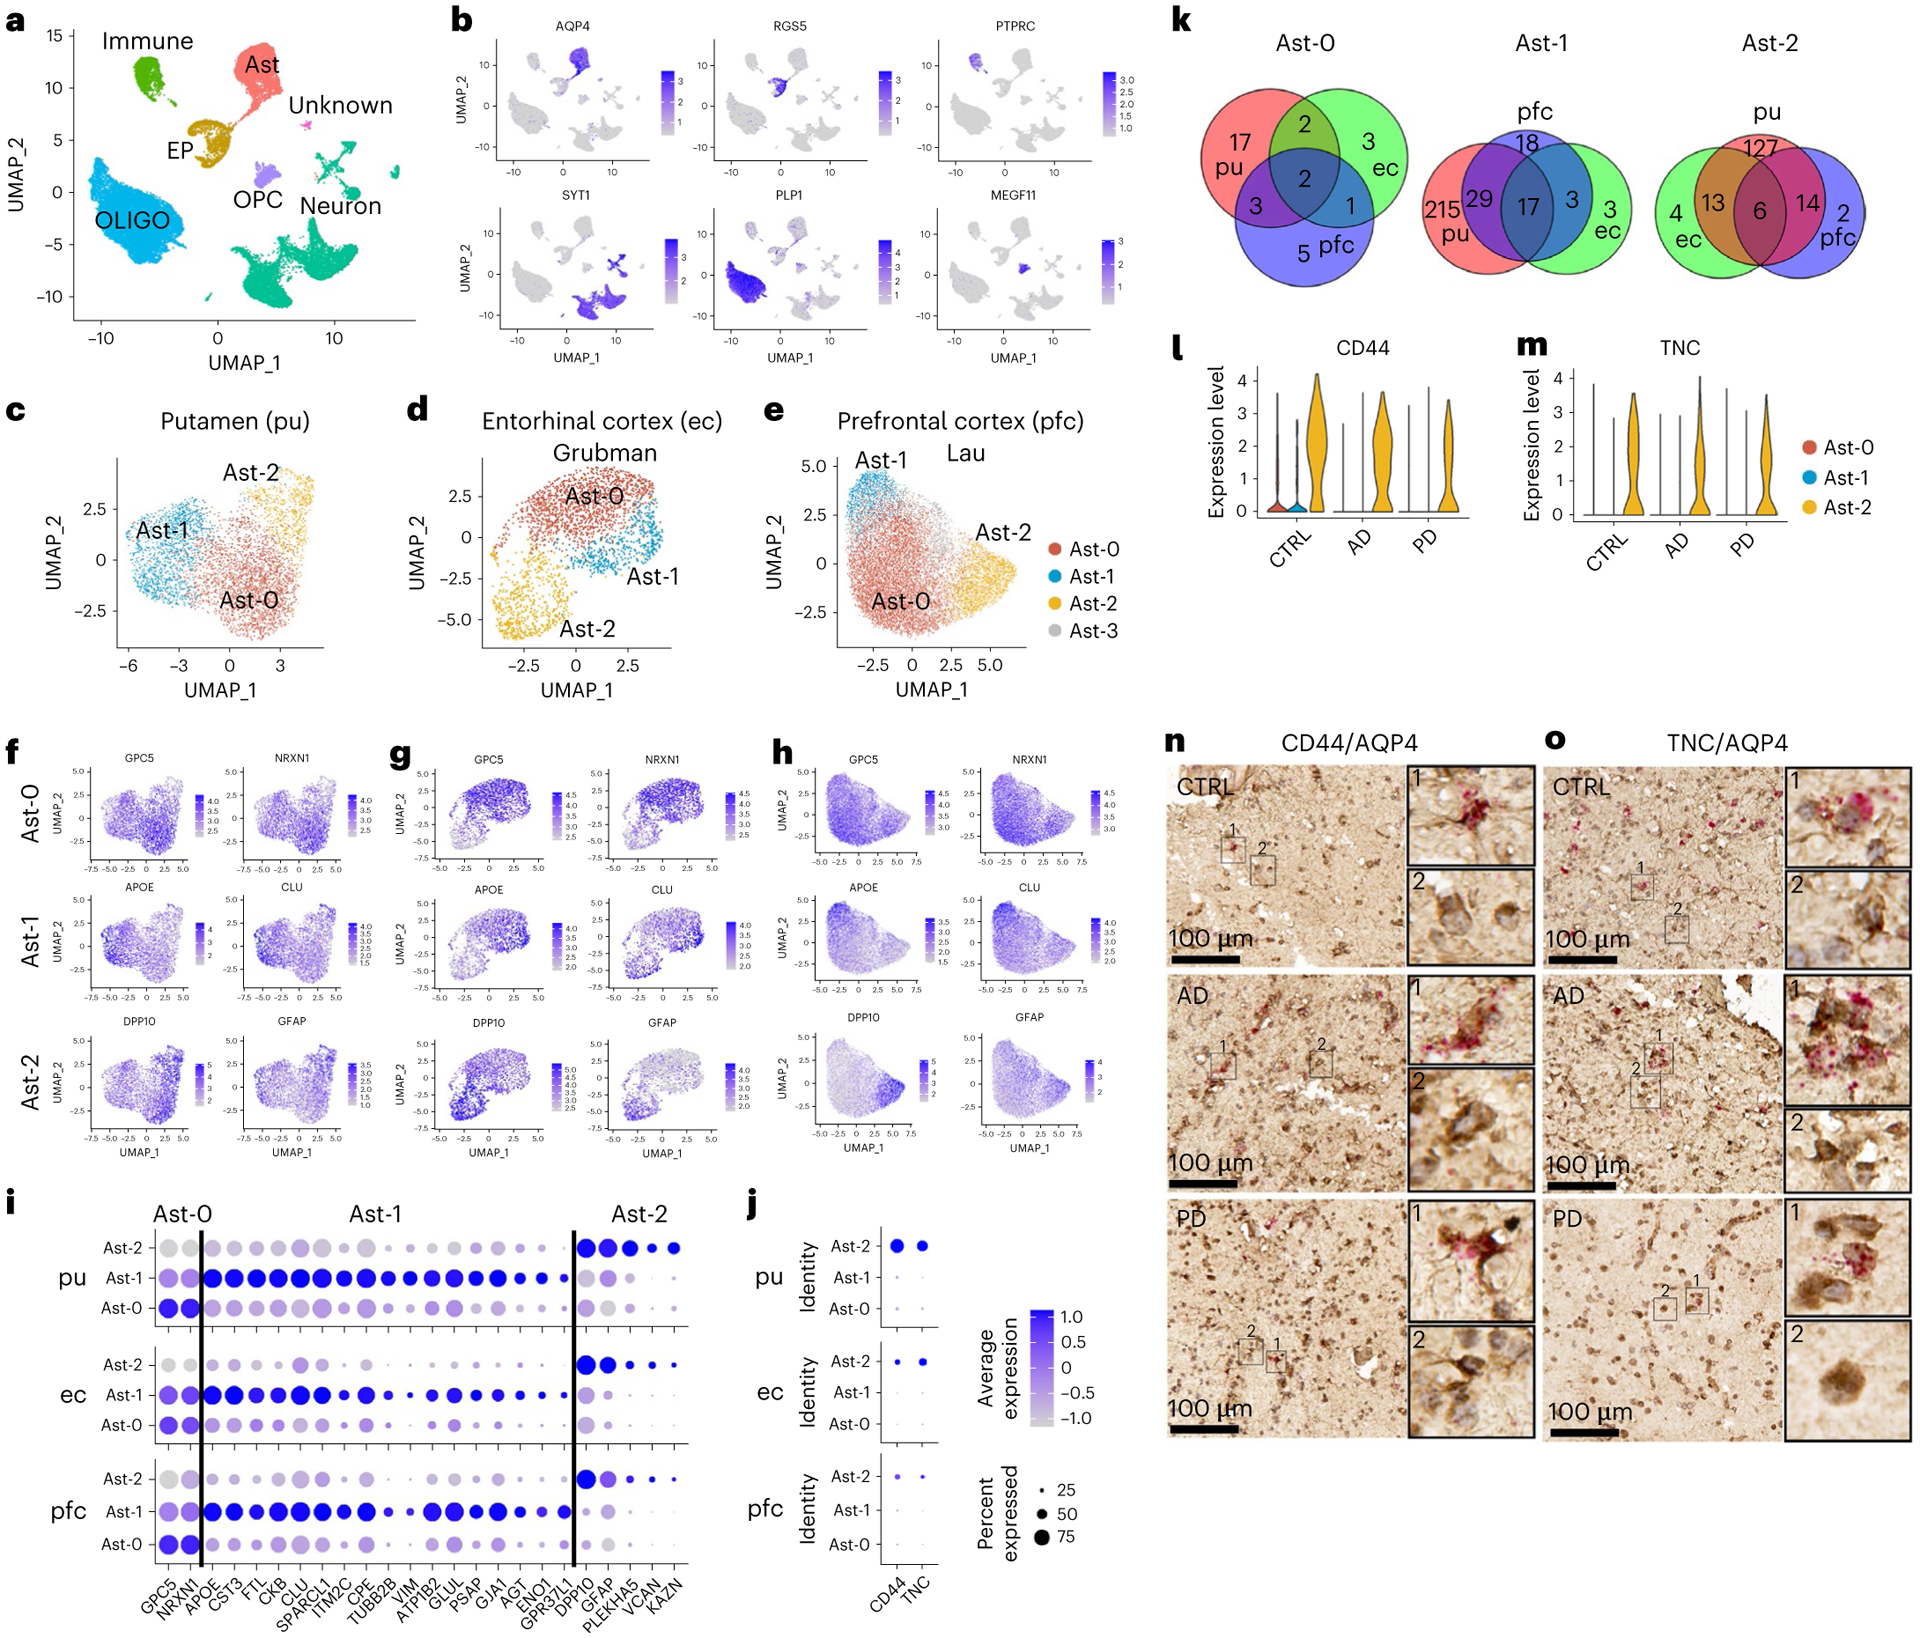
Fig. 1 |. Characterization of six major cell types and three distinct astrocyte subpopulations.

a, Unsupervised clustering of snRNA-seq data and UMAP (Uniform Manifold Approximation and Projection) plot of all cells from putamen (pu) colored by cluster identity. UMAP plots were generated using default parameters except reduction = ’pca’, dims = 1:20. b, UMAP plot of all cells colored by marker gene expression levels. c–e, UMAP visualization of astrocyte subpopulations colored by cluster identity for putamen (c; total nuclei: control 1,203, AD 1,642, PD 1,433), ec (d; control 1,660, AD 702) and pfc (e; control 6,109, AD 7,144) astrocytes. f–h, UMAP visualization of astrocyte subpopulations colored by conserved marker gene expression levels for putamen (f), ec (g) and pfc astrocytes (h). i,j, Dot plot of conserved marker genes (i) and CD44 and TNC expression levels (j) in Ast-0, Ast-1 and Ast-2 astrocytes from the three brain regions. k, Venn diagram demonstrating overlap of conserved marker genes among the three brain regions for each astrocyte subpopulation. l,m, Violin plot showing the expression of Ast-2 conserved marker genes CD44 (l) and TNC (m) measured by snRNA-seq. n,o, CD44 (n) and TNC (o) expression validated by RNAScope in situ hybridization together with AQP4 immunohistochemistry staining in the putamen of control, AD and PD samples. CD44 and TNC, red; AQP4, tan. For all data, the experiment was performed once. FindConservedMarkers using Wilcoxon rank sum test and metap R package with meta-analysis combined P value < 0.05. Scale bars, 100 μm. CTRL, control; immune, immune cell; Ast, astrocyte; EP, endothelial cell and pericyte; OLIGO, oligodendrocytes; OPC, oligodendrocyte precursor cell.
