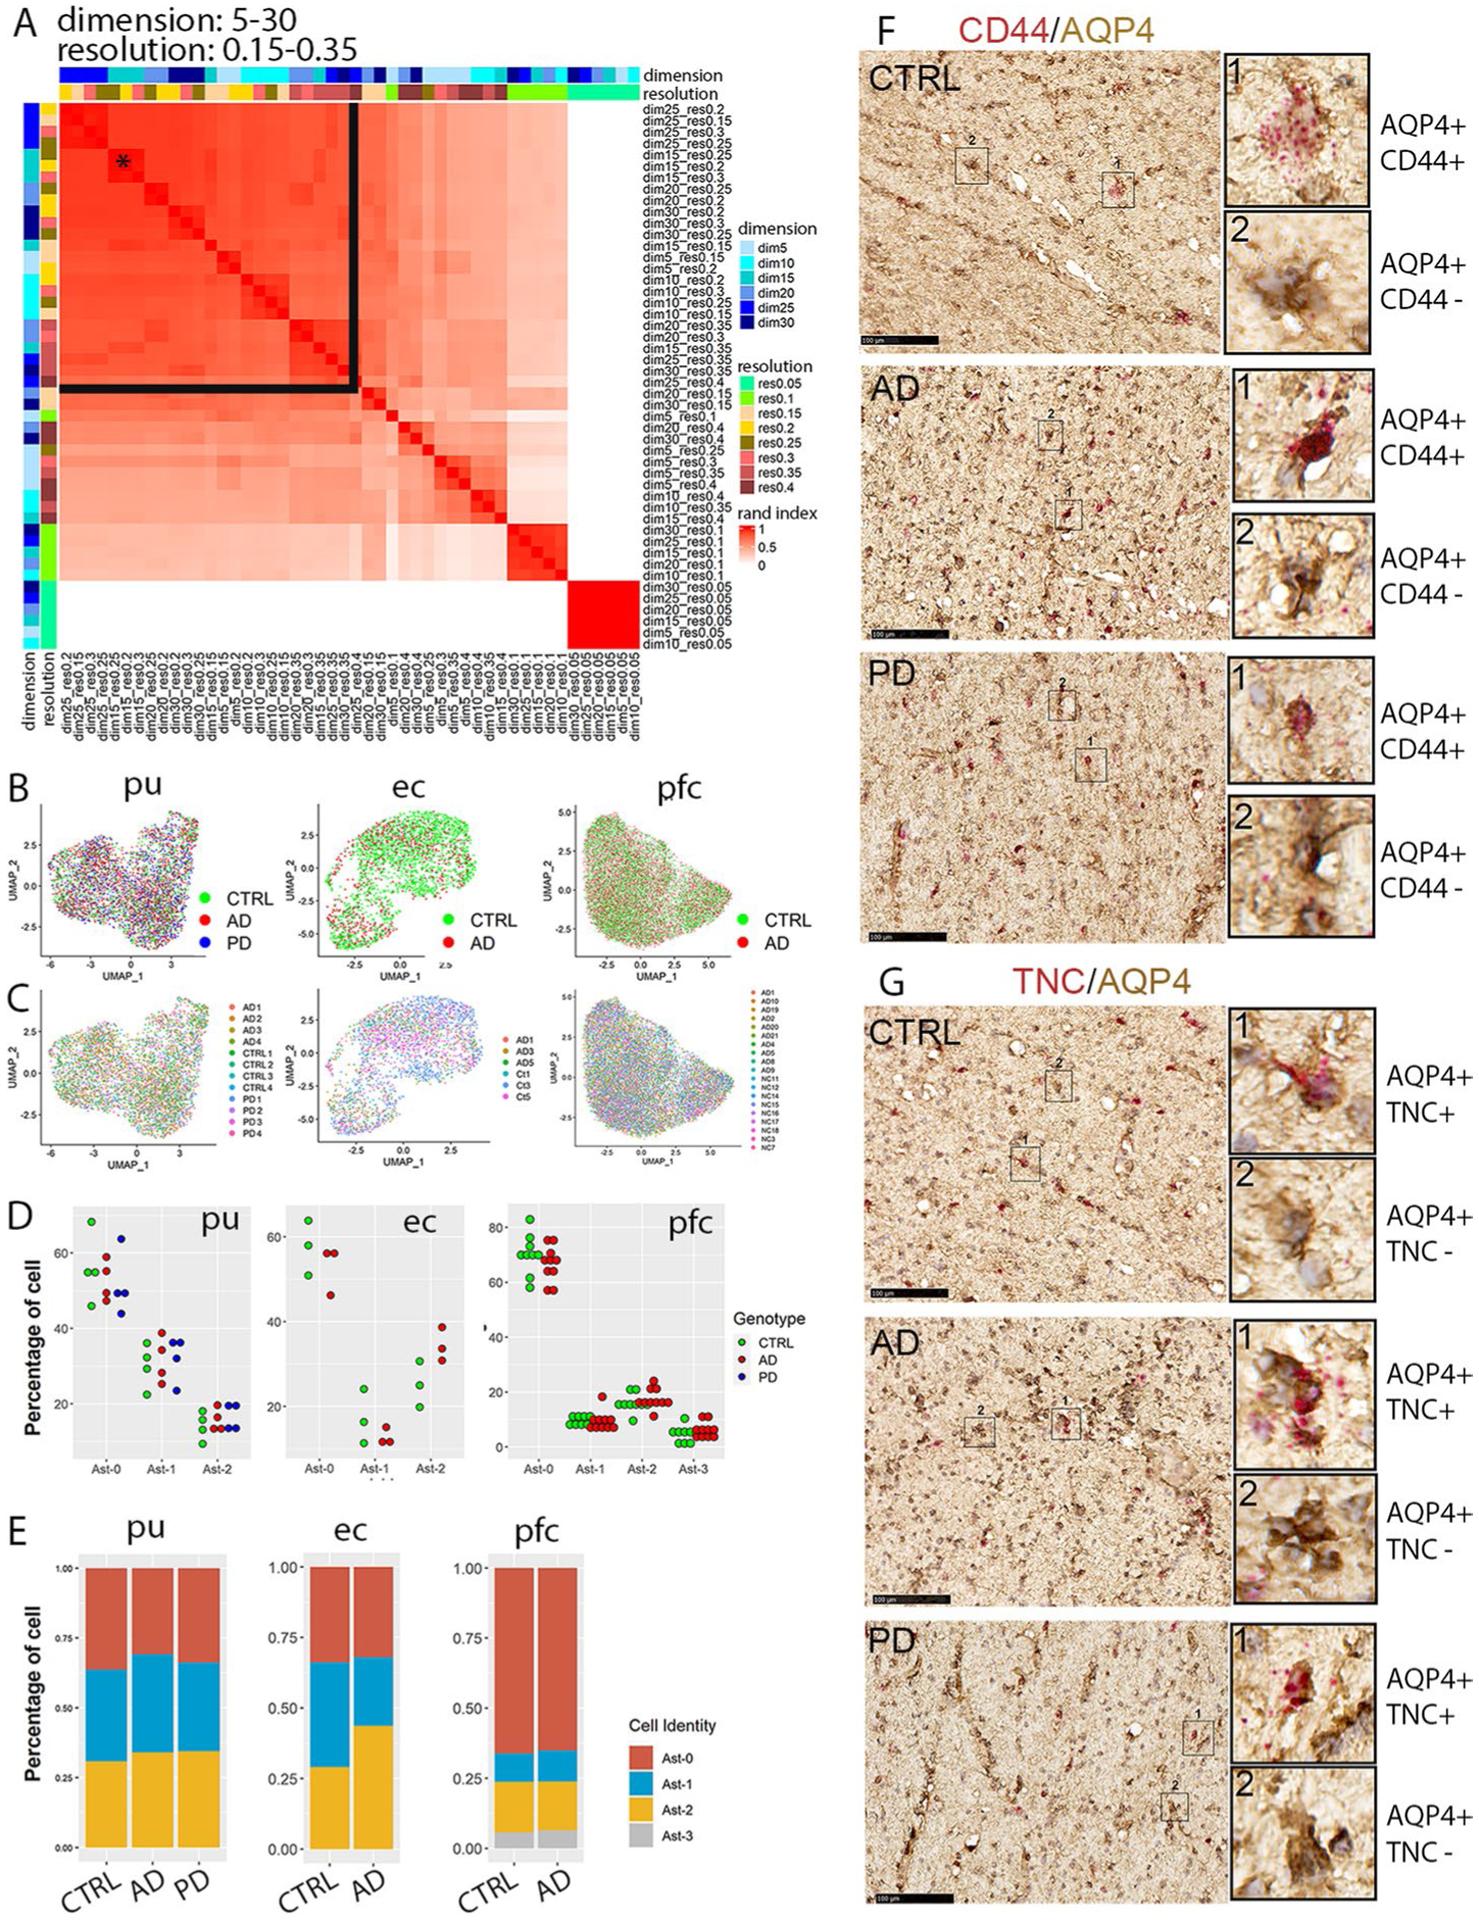
Extended Data Fig. 2 |. Identification and validation of the three astrocytes subpopulations.

a, Heatmap plot of the adjusted rand index (ARI) of pair-wise clustering result comparison using all cells with a range of dimensionality (5–30) and resolution (0.05–0.35). The black star indicates the parameter selected for all downstream analyses including analyses of entorhinal and prefrontal cortex astrocytes (dimensionality = 15, resolution = 0.25). The black lines delineate the range of parameters that generated high ARIs. b,c, UMAP visualization of subclusters of astrocytes colored by (b) disease diagnosis or (c) individual identity. d, Distribution of cells from each diagnostic group in the astrocyte subpopulations. Each dot represents an individual except entorhinal cortex data where each dot represents samples from two subjects that were processed together. e, Distribution of cells from each astrocyte subpopulation in different diagnostic groups. f,g, RNAscope in situ hybridization (ISH) analysis of Ast-2 conserved marker genes CD44 (f) and TNC (g) transcript expression (red) and immunohistochemistry staining (brown) of AQP4 in the internal capsule tissue sections of the same subjects of the control (CTRL), AD and PD groups shown in Fig. 1. For all data, the experiment was performed once. Hematoxylin-positive cell nuclei are shown in blue. Scale bar = 100 μm.
