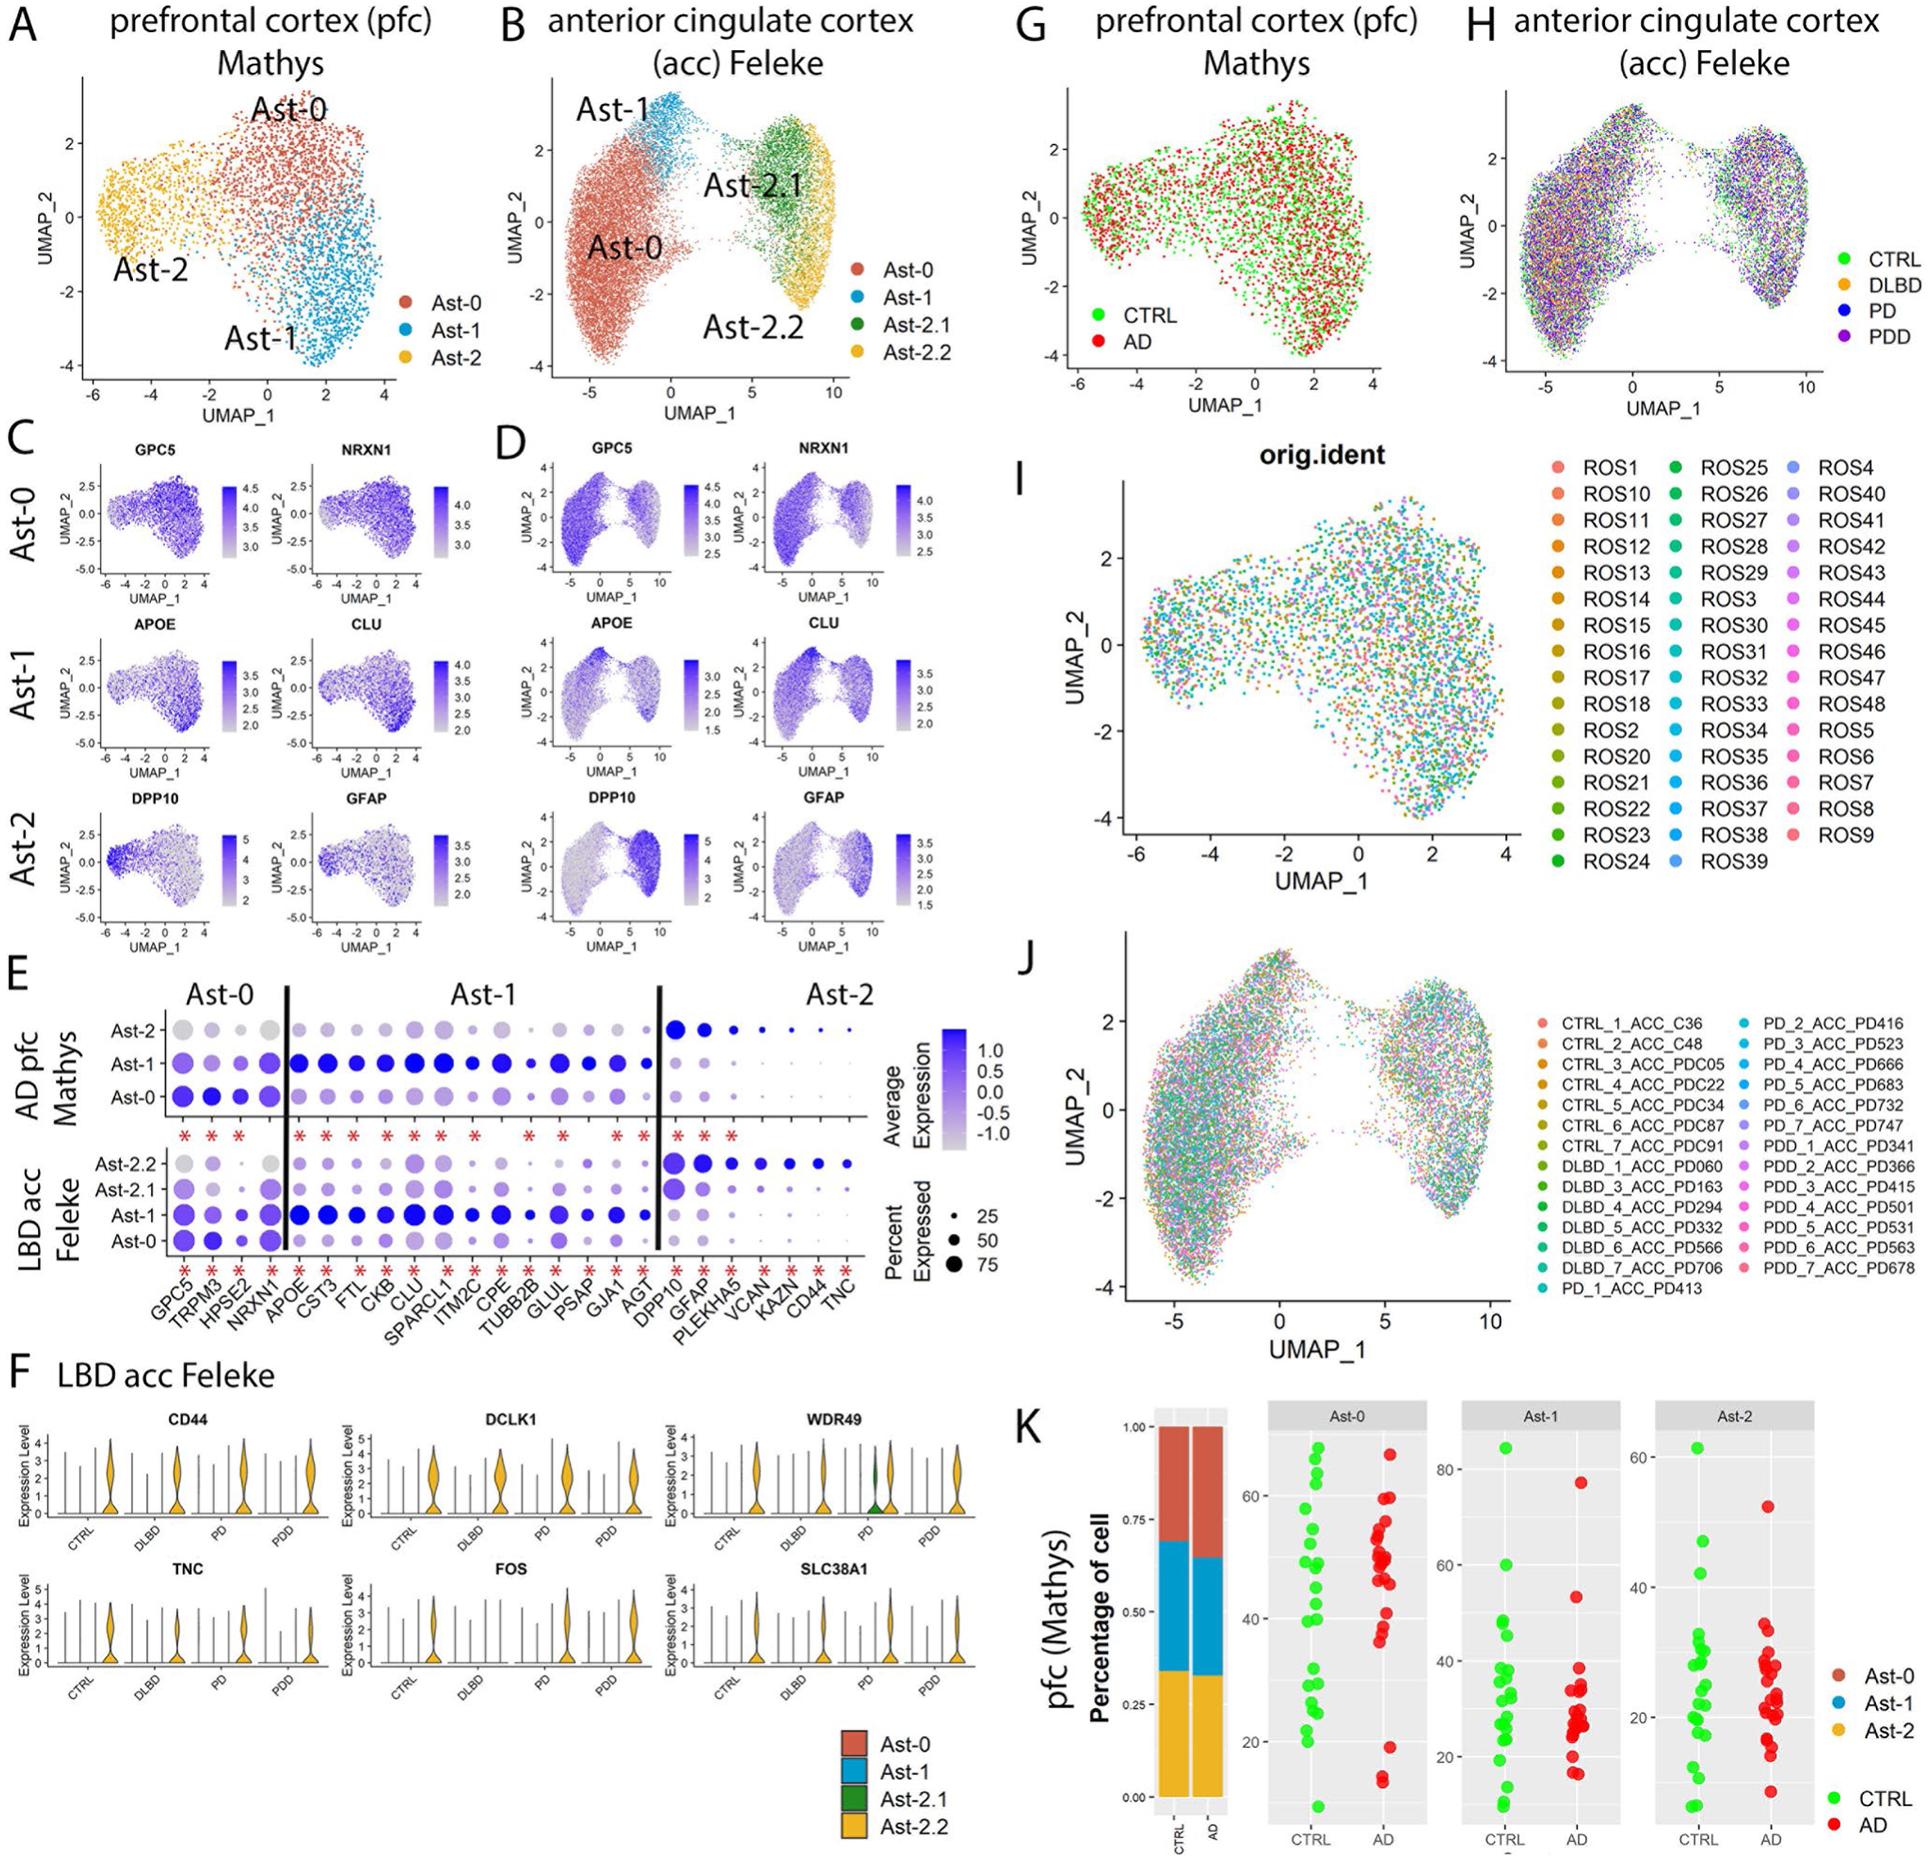
Extended Data Fig. 3 |. Characterization of astrocyte subpopulations in the prefrontal cortex (pfc) of Mathys et al., 2019 and the anterior cingulate cortex (acc) of the Feleke et al. 2021 data.

a,b, UMAP visualization of astrocyte subpopulations colored by cluster identity for (a) prefrontal cortex and (b) anterior cingulate cortex astrocytes. c,d UMAP visualization of astrocyte subpopulations colored by conserved marker gene expression levels for (c) prefrontal cortex and (d) anterior cingulate cortex. e, Dot plot of conserved marker gene expression levels in Ast-0, Ast-1 and Ast-2 astrocytes from the two brain regions. f, Violin plot showing the expression of Ast-2 conserved marker genes shared with putamen Ast-2. g–j UMAP visualization of subclusters of astrocytes colored by (g,h) disease diagnosis or (i,j) individual identity. k, The distribution of cells from each astrocyte subpopulation in different diagnostic groups (left) and the distribution of cells from each diagnostic group in the astrocyte subpopulations (right) of the Mathys et al., 2019 data. Each dot represents an individual. Conserved marker genes were genes whose expression is significantly higher than its expression in other cell clusters in all diagnostic groups determined by FindConservedMarkers using Wilcoxon Rank Sum test and metap R package with meta-analysis combined P value < 0.05. Red asterisks (*) indicate statistical significant conserved marker genes.
