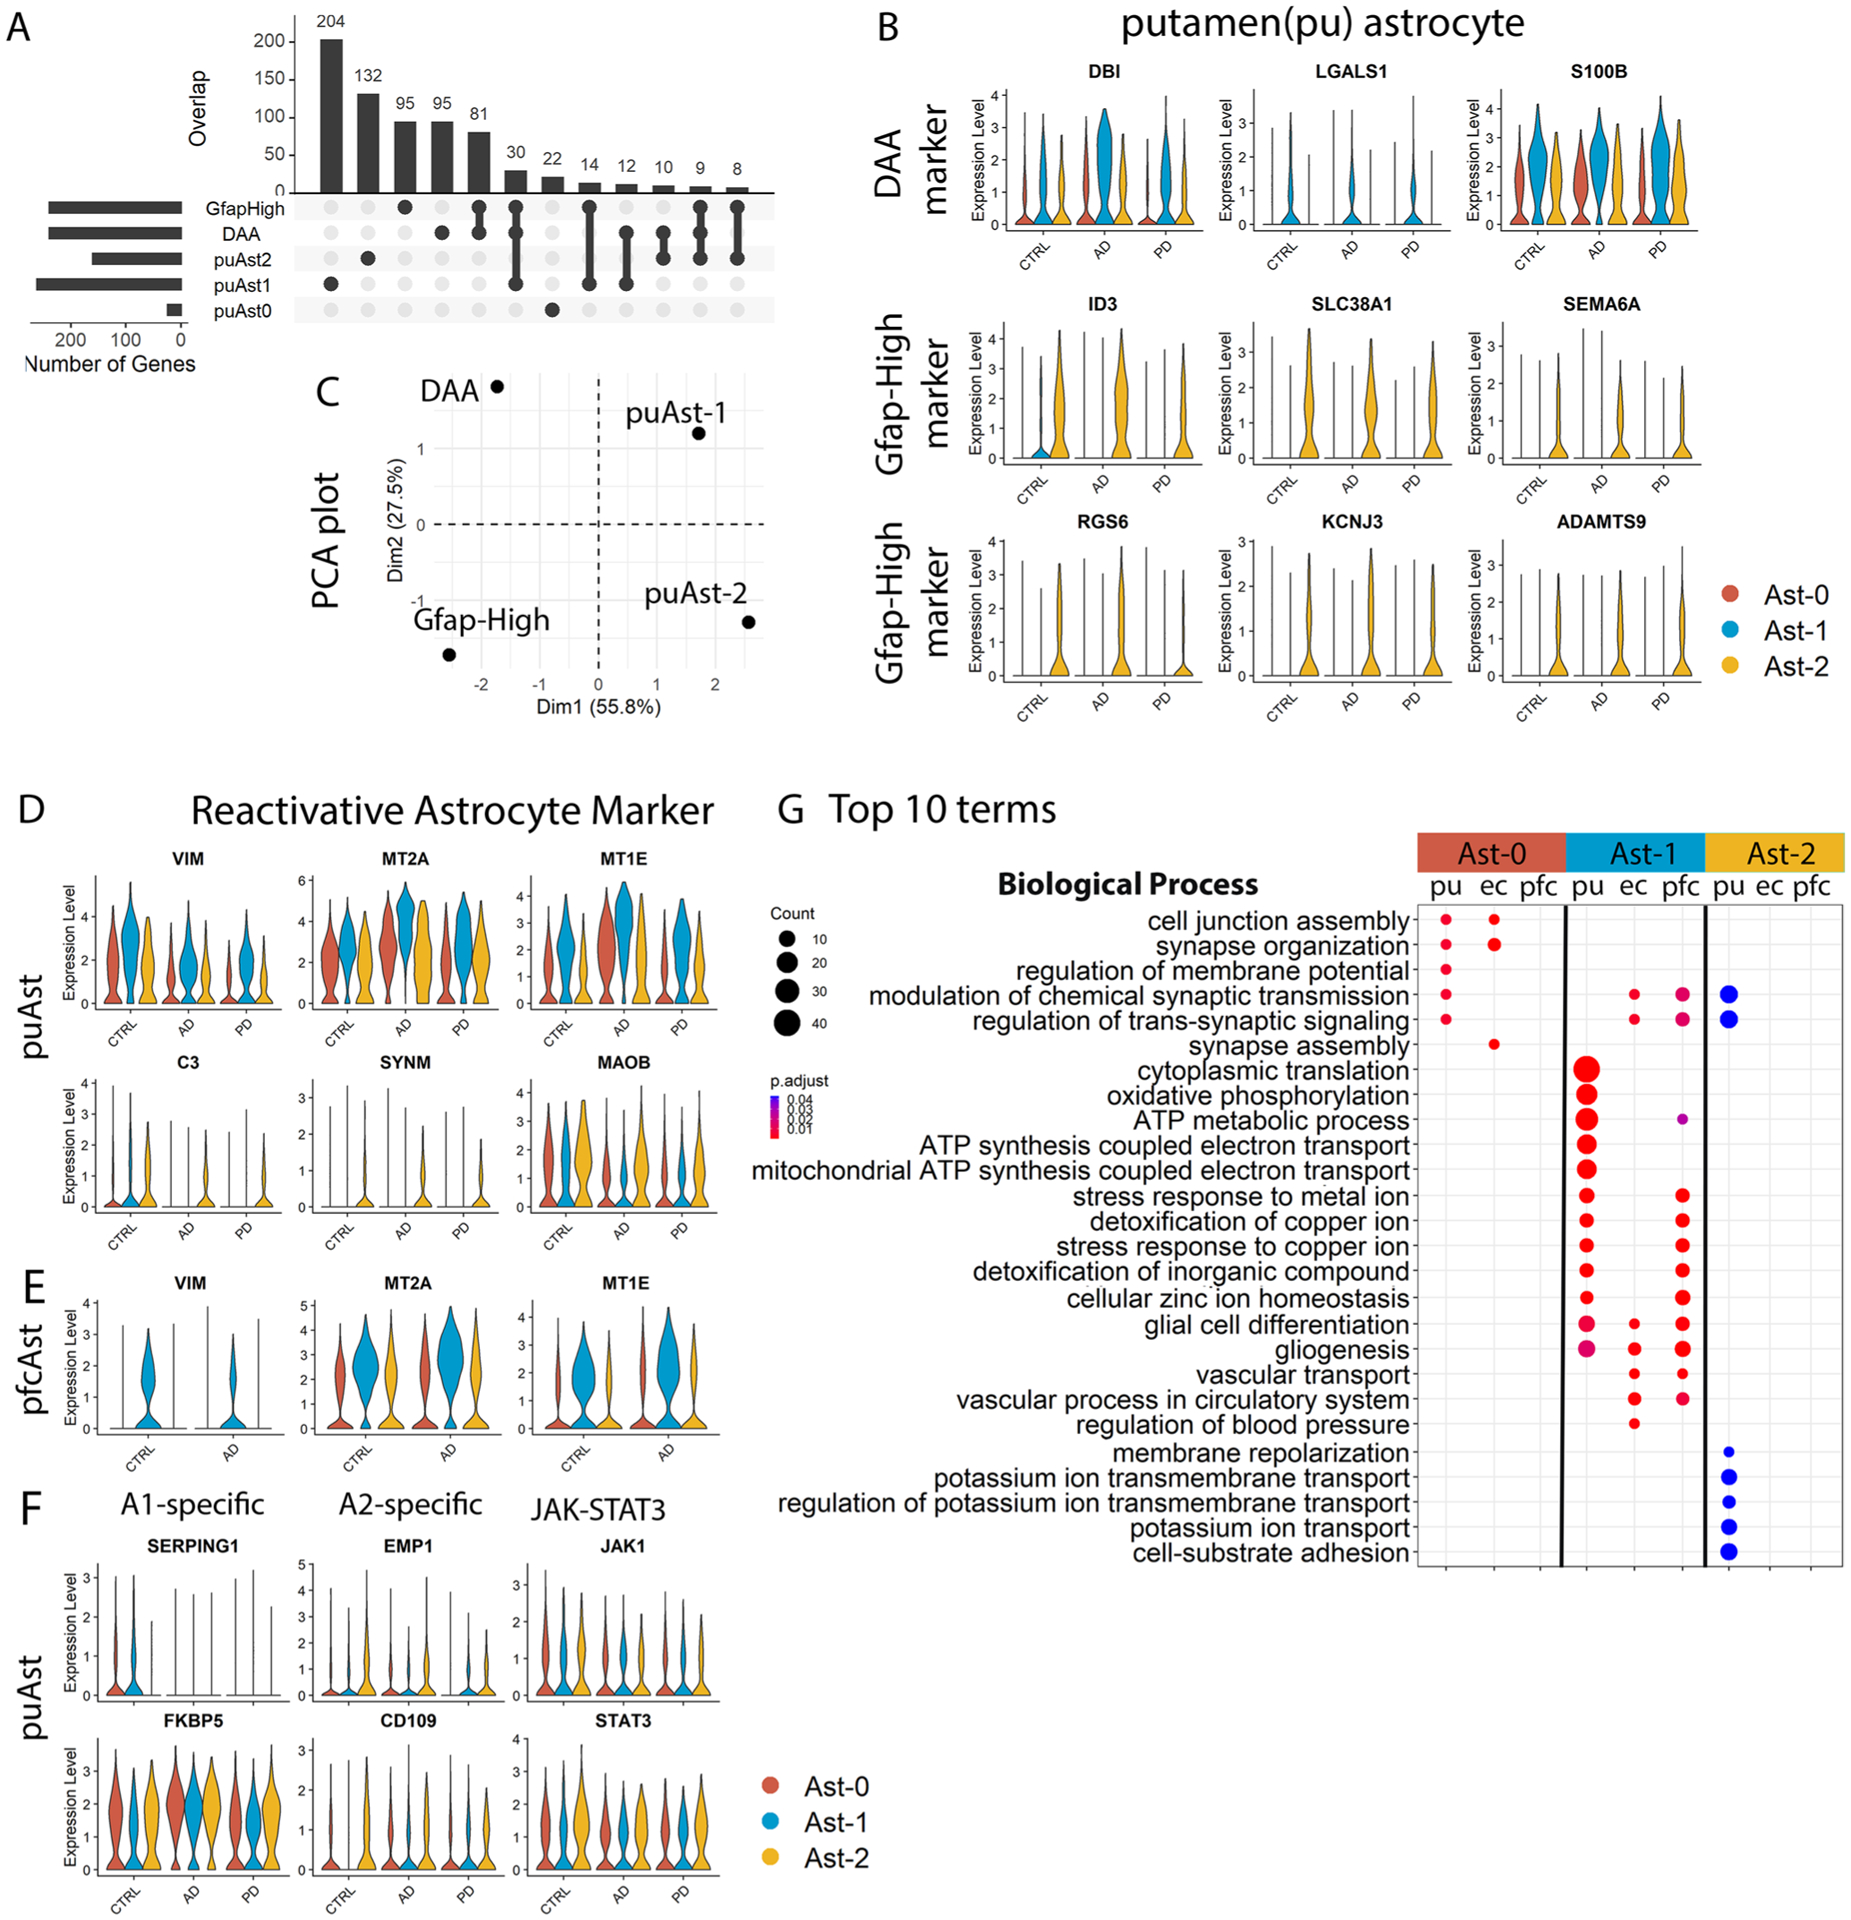
Extended Data Fig. 4 |. Characterization and comparison of the three astrocytes subpopulations from the putamen (pu), entorhinal cortex (ec), and prefrontal cortex (pfc) of Lau et al. data.

a, Upset plot showing the overlap between putamen conserved marker genes of Ast-0, Ast-1 and Ast-2 astrocyte with marker genes of mouse DAA and Gfap-high astrocytes from Habib et al., 2020. b, Violin plots showing the expression level distributions of orthologous genes of murine DAA and Gfap-high astrocyte marker genes in the putamen astrocytes. c, PCA plot using murine DAA and Gfap-high astrocyte marker gene logFC of gene expression (comparing murine DAA and Gfap-high astrocyte with Gfap-low astrocytes, downloaded from Habib et al., 2020) and the logFC of the human orthologous genes (comparing putamen Ast-1 and Ast-2 with Ast-0 astrocytes). d,e, Violin plots showing the expression level distributions of reactive astrocyte marker genes in astrocytes from the (d) putamen and (e) prefrontal cortex. f, Violin plots showing the expression level distributions of A1-, A2-specific activated astrocyte markers and JAK-STAT3 pathway genes. g, Top 10 GO terms in the Biological Process category enriched in the astrocyte subpopulation signature genes (hypergeometric test, FDR-adjusted P value < 0.05, ≥ 5 query genes). Conserved marker genes plotted in panel (b), (d) and (e) were determined by FindConservedMarkers using Wilcoxon Rank Sum test and metap R package with meta-analysis combined P value < 0.05 comparing gene expression in the given cluster with the other cell clusters for AD (n = 4), PD (n = 4) and the controls (n = 4). Genes plotted in (f) were not statistically significantly higher in any of the astrocyte subpopulations.
