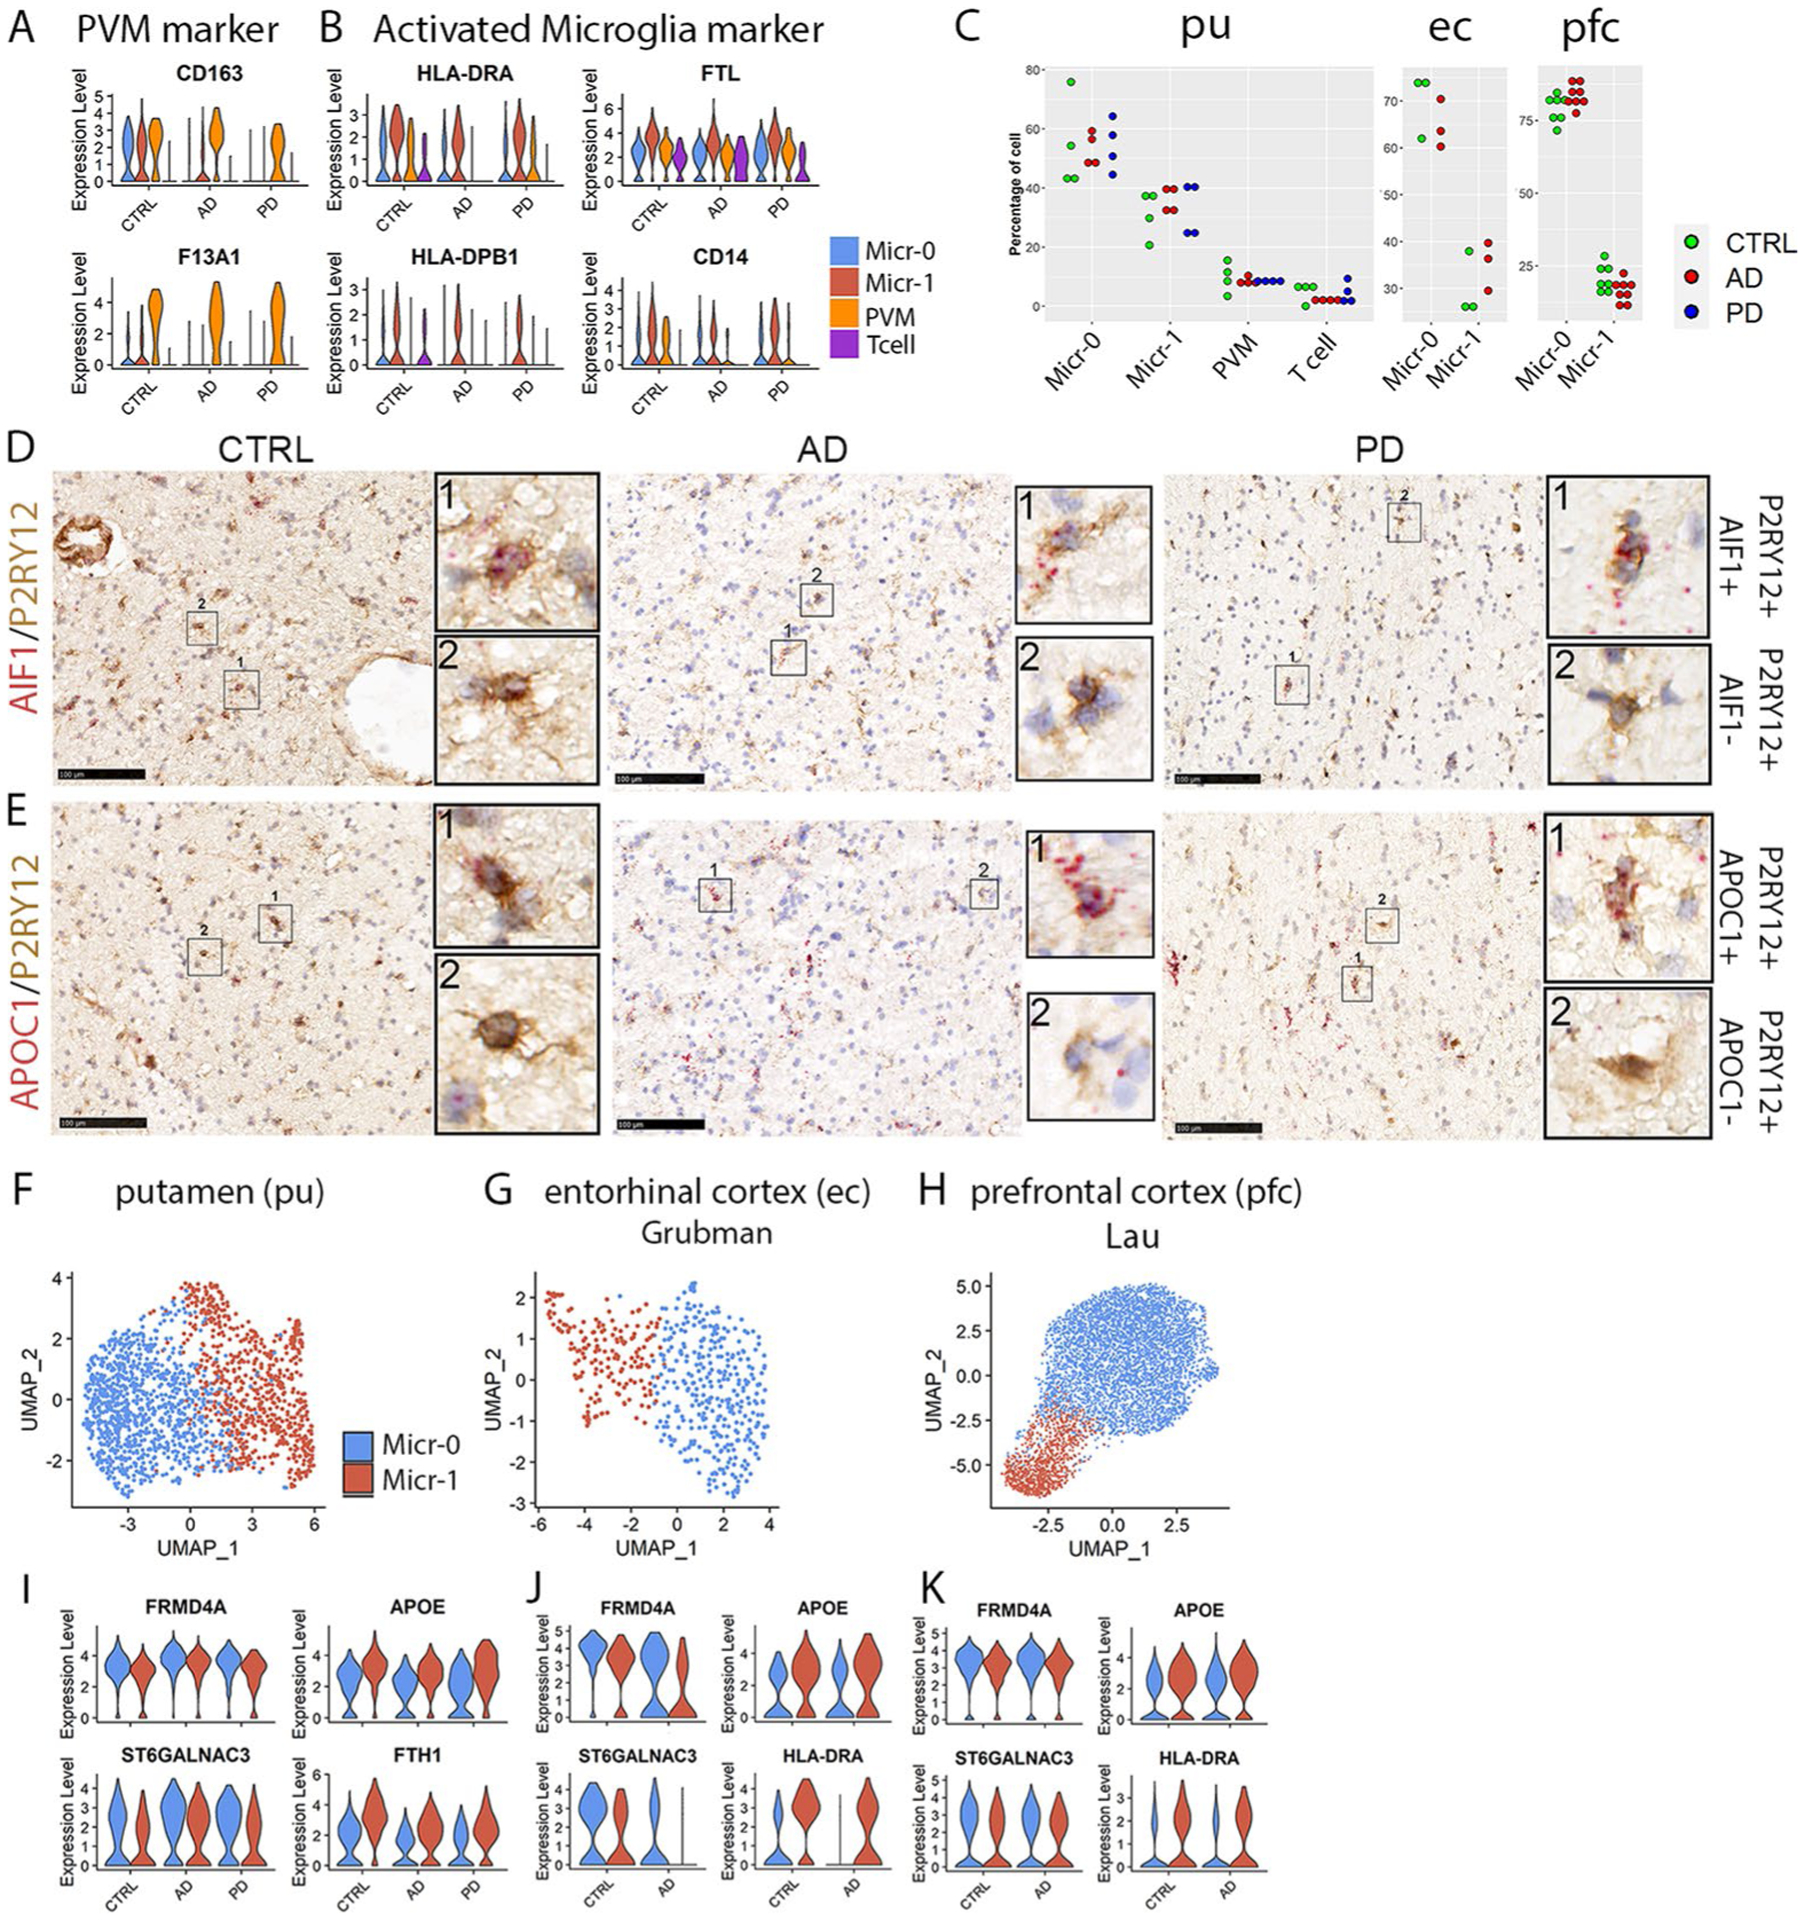
Extended Data Fig. 6 |. Identification of immune cells and validation of microglia subpopulations.

a,b, Violin plots showing the expression level distributions of marker genes for (a) PVM and (b) activated microglia. c, Distribution of percentage of cells from each subject in each immune cell cluster of the putamen (pu), entorhinal cortex (ec) from the Grubman et al. data and prefrontal cortex (pfc) from the Lau et al. data (one-way ANOVA or student’s t-test). Each dot represents a subject except the ec data. d,e, Immunohistochemistry staining (brown) of microglia marker protein P2RY12 and RNAscope in situ hybridization (ISH) analysis (red) of (d) AIF1 and (e) APOC1 transcript expression in the internal capsule tissue of the same subjects shown in Fig. 1. Hematoxylin-positive cell nuclei are shown in blue. For all data, the experiment was performed once. f–h, UMAP visualization of only microglia subpopulations from (f) pu, (g) ec and (h) pfc. UMAPs were generated using a dimensionality of 10 and resolution of 0.15. i–k, Violin plots showing the expression level distributions of conserved microglial subpopulation marker genes in putamen (i), entorhinal cortex (j) and preprontal cortex (k) microglia subpopulations. Conserved marker genes plotted in panel (a), and HLA-DRA, HLA-DPB1, FTL and CD14 plotted in panel (b) were determined by FindConservedMarkers using Wilcoxon Rank Sum test and metap R package with meta-analysis combined P value < 0.05 comparing gene expression in the given cluster with the other cell clusters for AD (n = 4), PD (n = 4) and the controls (n = 4).
