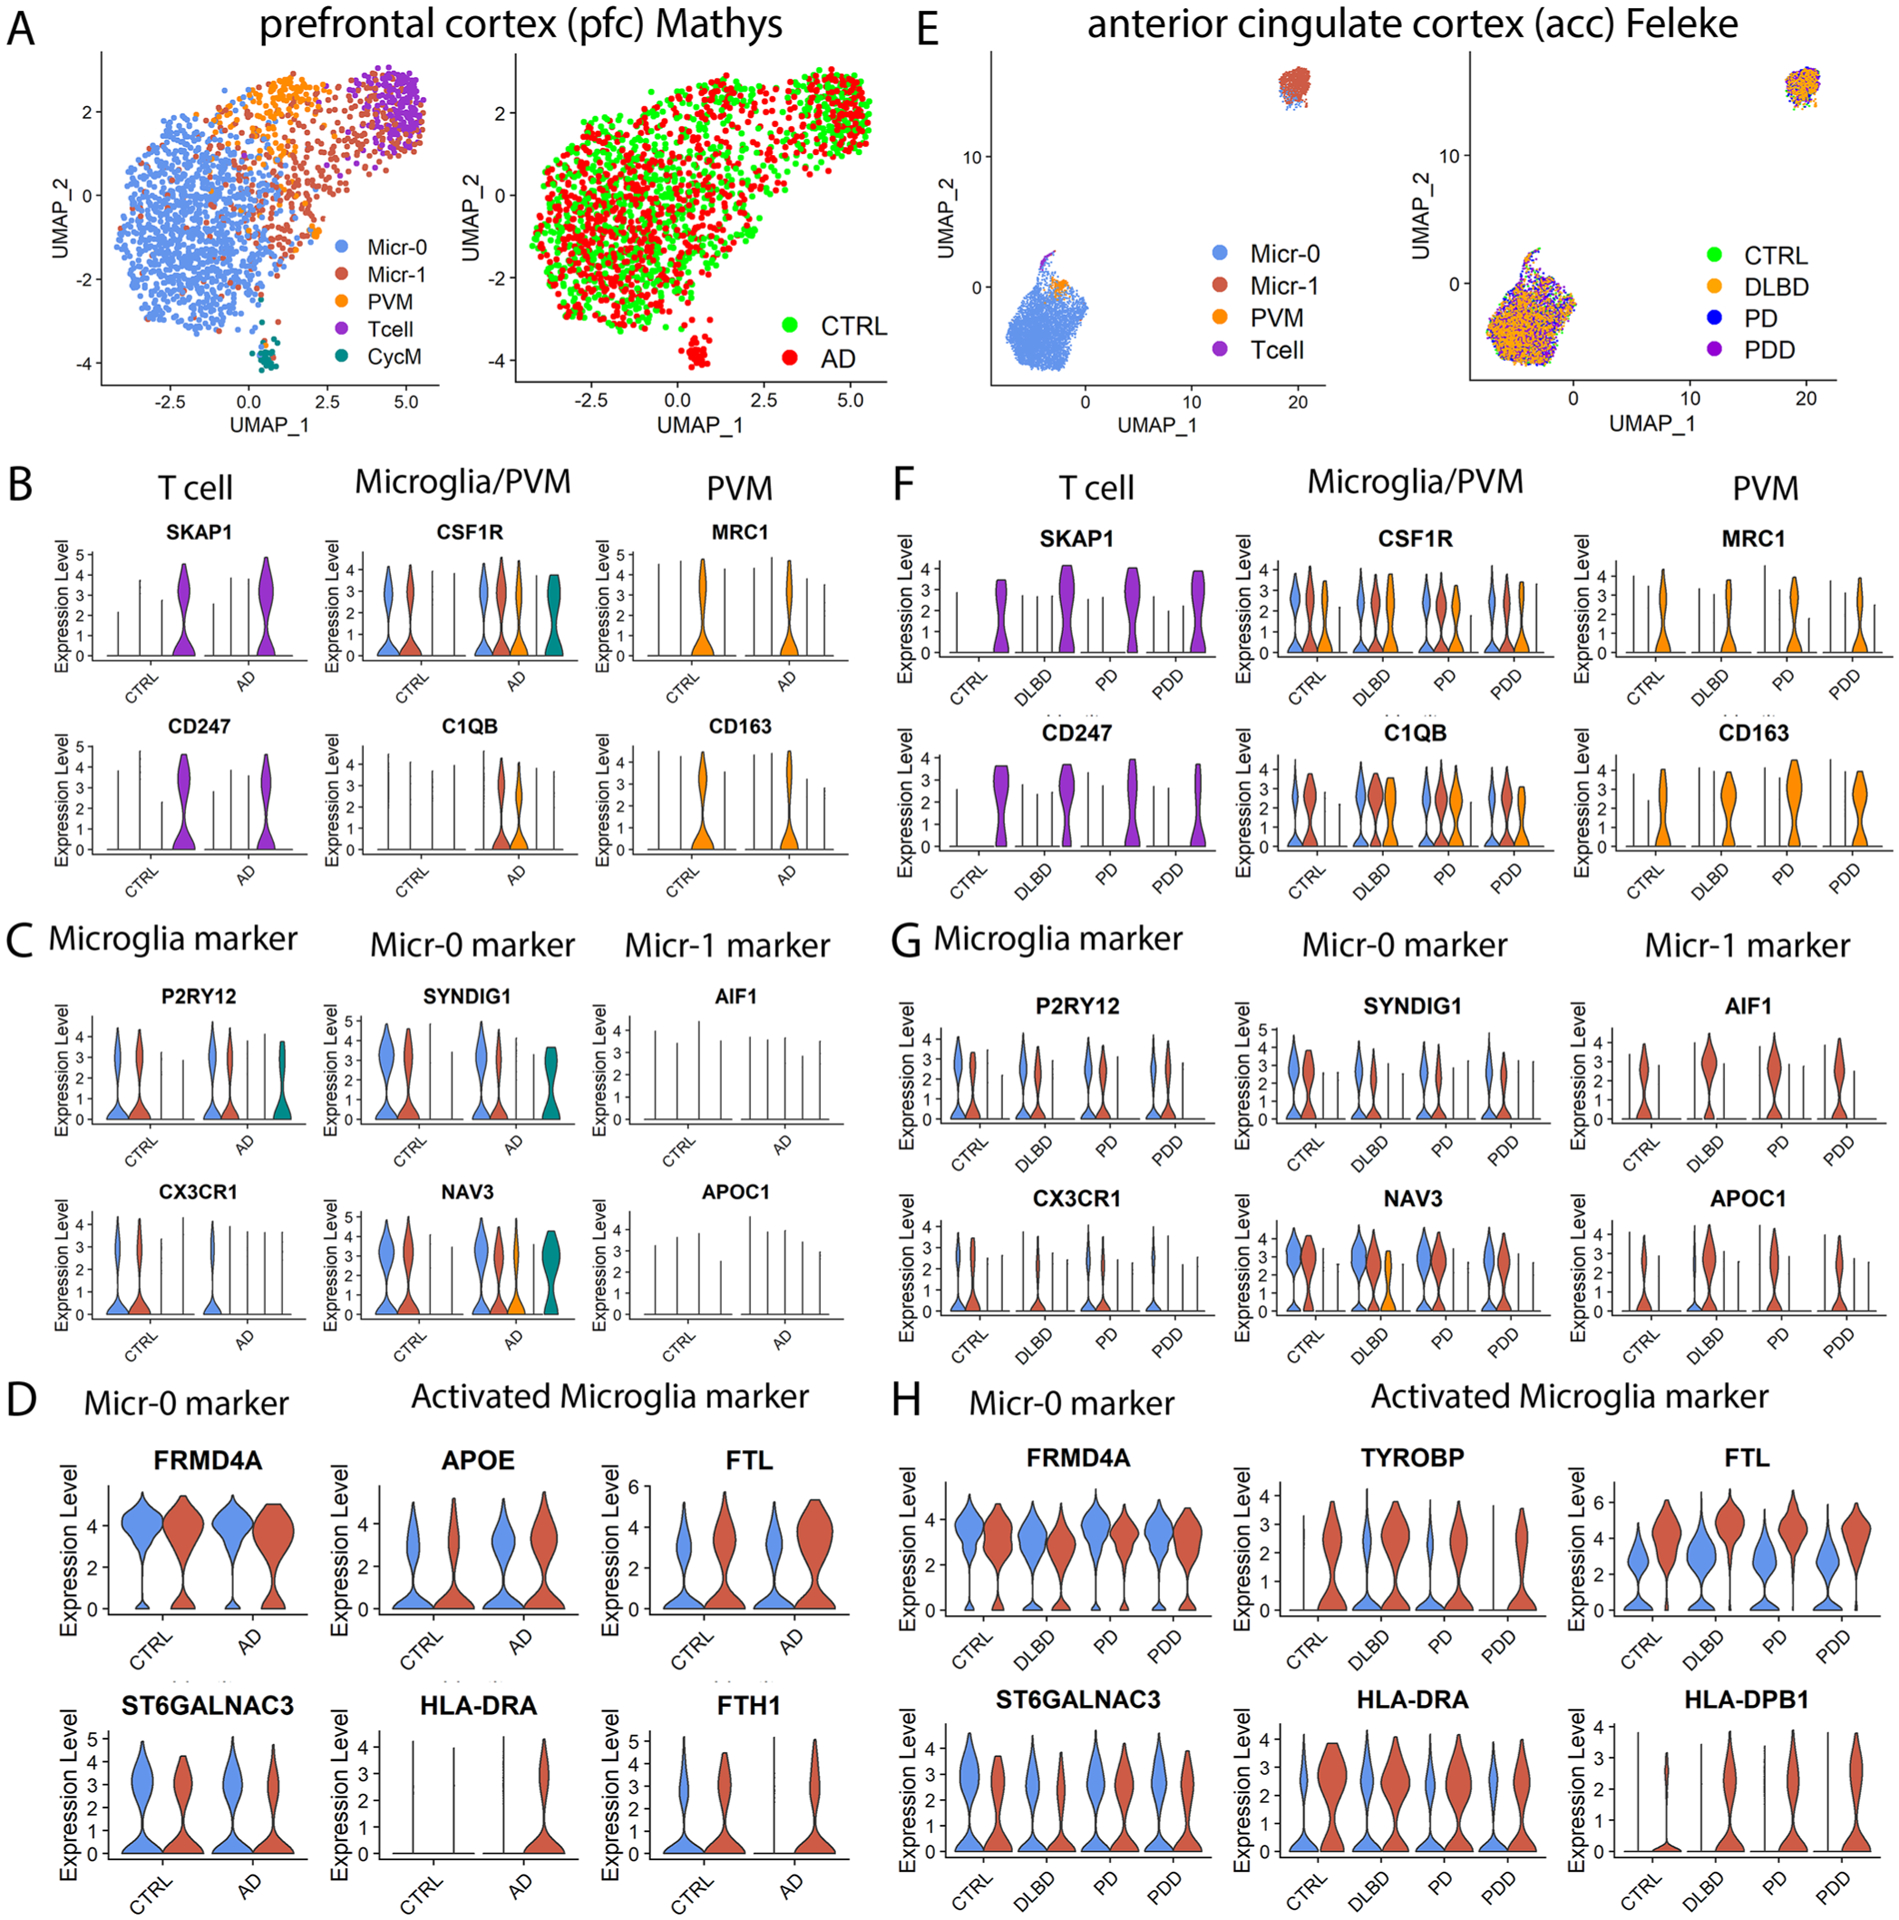
Extended Data Fig. 7 |. Four distinct immune cell populations in (A-D) the prefrontal cortex (pfc) of the Mathys et al., and (E-H) the anterior cingulate cortex (acc) data of the Feleke et al. data.

a,e, UMAP visualization of subclusters of immune cells colored by cell cluster (left) or disease diagnosis (right). UMAPs were generated using parameters of dimensionality of 40 and resolution of 0.5 for the Mathys et al. data (AD n = 24, controls n = 24) and dimensionality of 20 and resolution of 0.15 for the Feleke et al. data (n = 7 each for the control, DLBD, PD and PDD samples). Violin plots showing the expression level distributions of genes for (b, f) T cell, microglia and PVM shared markers and PVM unique markers; (c, g) microglia-specific markers, and microglia subpopulation markers; (d, h) Micr-0 marker and activated microglia markers. The color code is the same as in (a) and (e), respectively. The conserved marker genes were determined by FindConservedMarkers using Wilcoxon Rank Sum test and metap R package with meta-analysis combined P value < 0.05 comparing gene expression in the cells of given cluster with that of the other cells. PVM: perivascular macrophage; CycM: cycling microglia.
