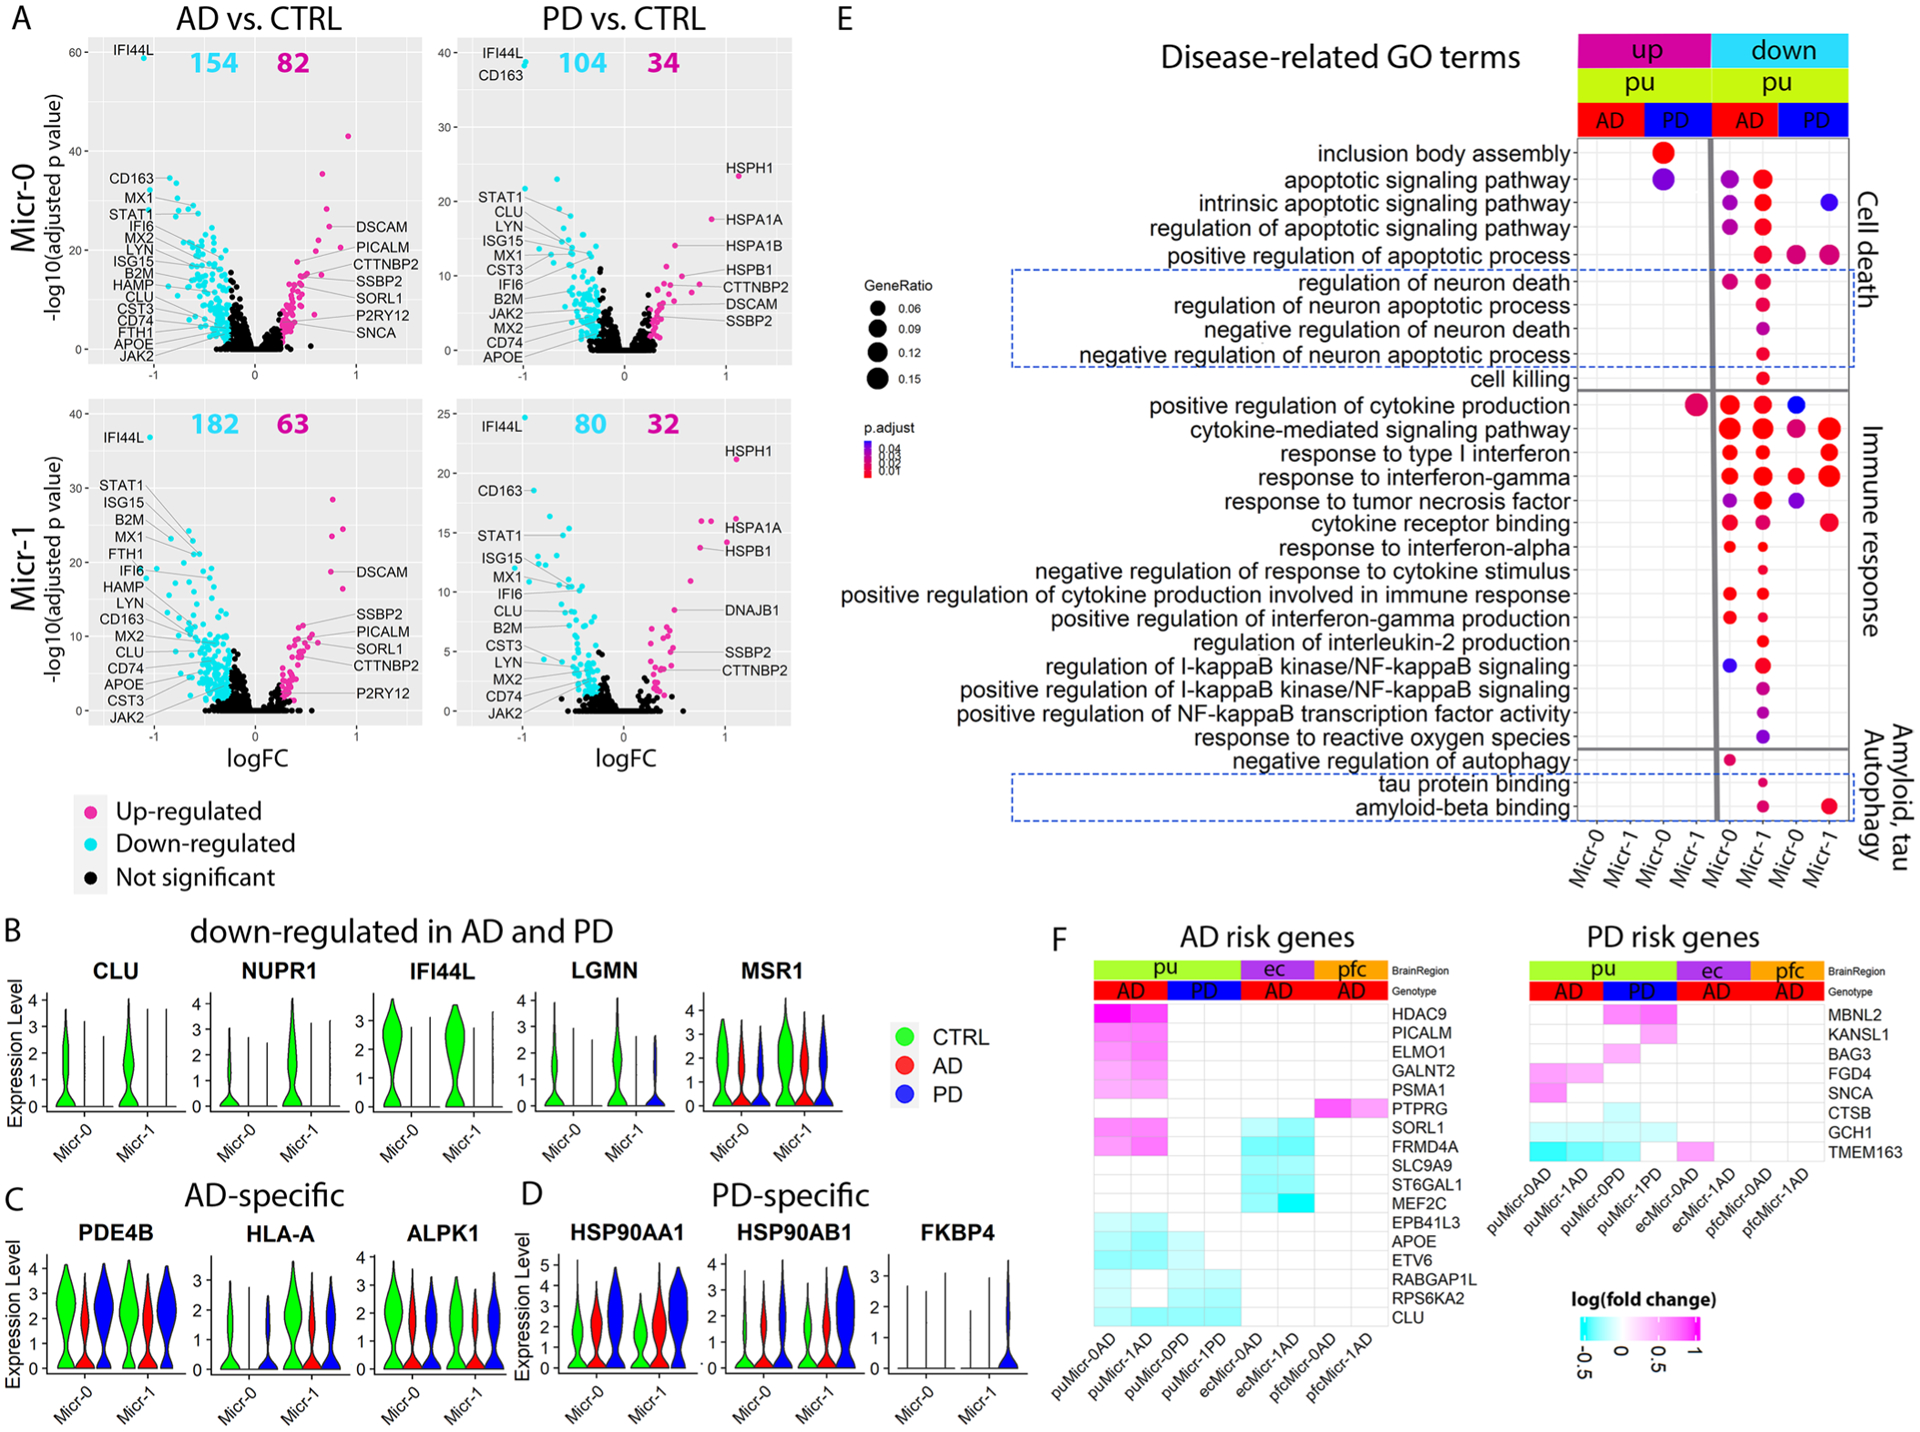
Extended Data Fig. 9 |. Microglia transcriptomic changes in disease contributed to Aβ pathology, tauopathy and neuronal death.

a–d, Volcano plots showing significant DEGs in Micr-0 and Micr-1 comparing cells from AD (left panels) or PD (right panels) with cells from the controls (CTRL). The x-axis specifies the logFC and the y-axis specifies the negative logarithm to the base 10 of the FDR-adjusted P values. Magenta and cyan dots represent genes expressed at significantly higher or lower levels respectively in disease samples (Wilcoxon Rank Sum test, FDR-adjusted P value < 0.05, absolute logFC > 0.25) comparing AD (Micr-0 = 440, Micr-1 = 299 cells) or PD (Micr-0 = 329, Micr-1 = 201 cells) microglia to the control (Micr-0 = 264, Micr-1 = 198 cells) microglia. Violin plots showing the expression level distributions of example DEGs that were (b) downregulated in both AD and PD microglia, (c) uniquely downregulated in AD or (d) uniquely upregulated in PD. e, GO terms related to neuron death, Aβ pathology and tauopathy enriched in microglial DEGs (hypergeometric test, FDR-adjusted P value < 0.05, ≥ 5 query genes). f, Heatmaps showing the logFC of expression level of significant DEGs for GWAS AD- and PD-risk genes; GWAS genes differentially expressed in at least two subpopulations were plotted for visualization. UP: upregulated in disease samples. Down: downregulated in disease samples.
