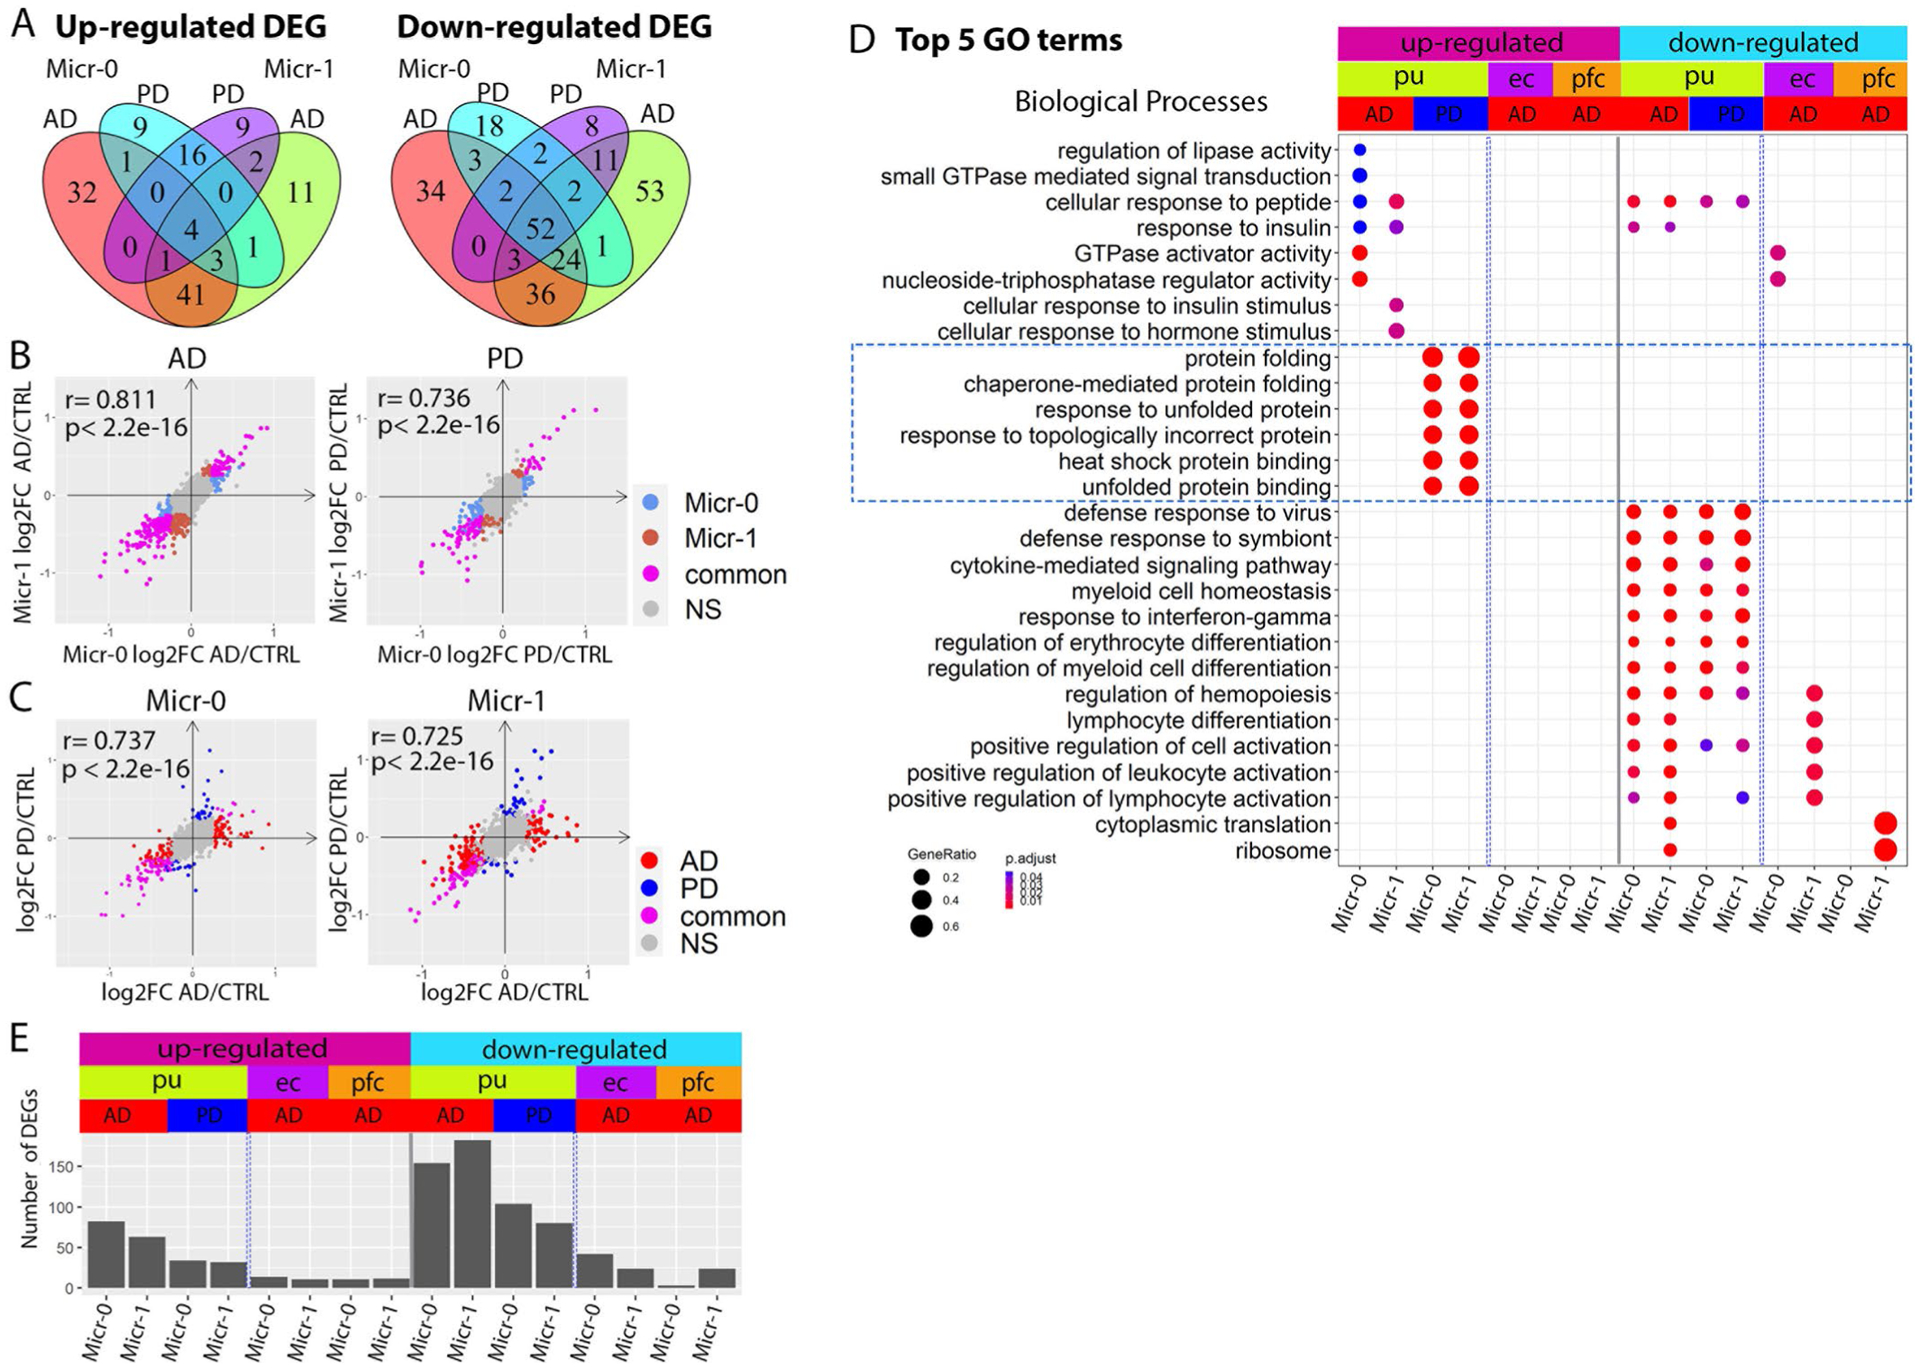
Extended Data Fig. 10 |. Comparison of microglia DEGs.

a, Venn diagram demonstrating overlap between AD and PD DEGs in the Micr-0 and Micr-1 cells for DEGs upregulated (left) or downregulated (right) in the disease samples. b,c, Scatter plots showing pair-wise correlations of genome-wide gene expression logFC (b) between Micr-0 and Micr-1 in AD (left) or PD (right) samples and (c) between AD and PD samples in Micr-0 (left) or Micr-1 (right) cells respectively. d, Top 5 GO terms in the biological process category enriched in the DEGs of the microglia subpopulations from the putamen (pu), entorhinal cortex (ec), prefrontal cortex (pfc) (hypergeometric test, FDR-adjusted P value < 0.05, ≥ 5 query genes). e, Bar plot showing the number of DEGs for each subpopulation of microglia from the three brain regions (Wilcoxon Rank Sum test, FDR-adjusted P value < 0.05 and absolute logFC >0.25). UP: upregulated in disease samples. Down: downregulated in disease samples.
