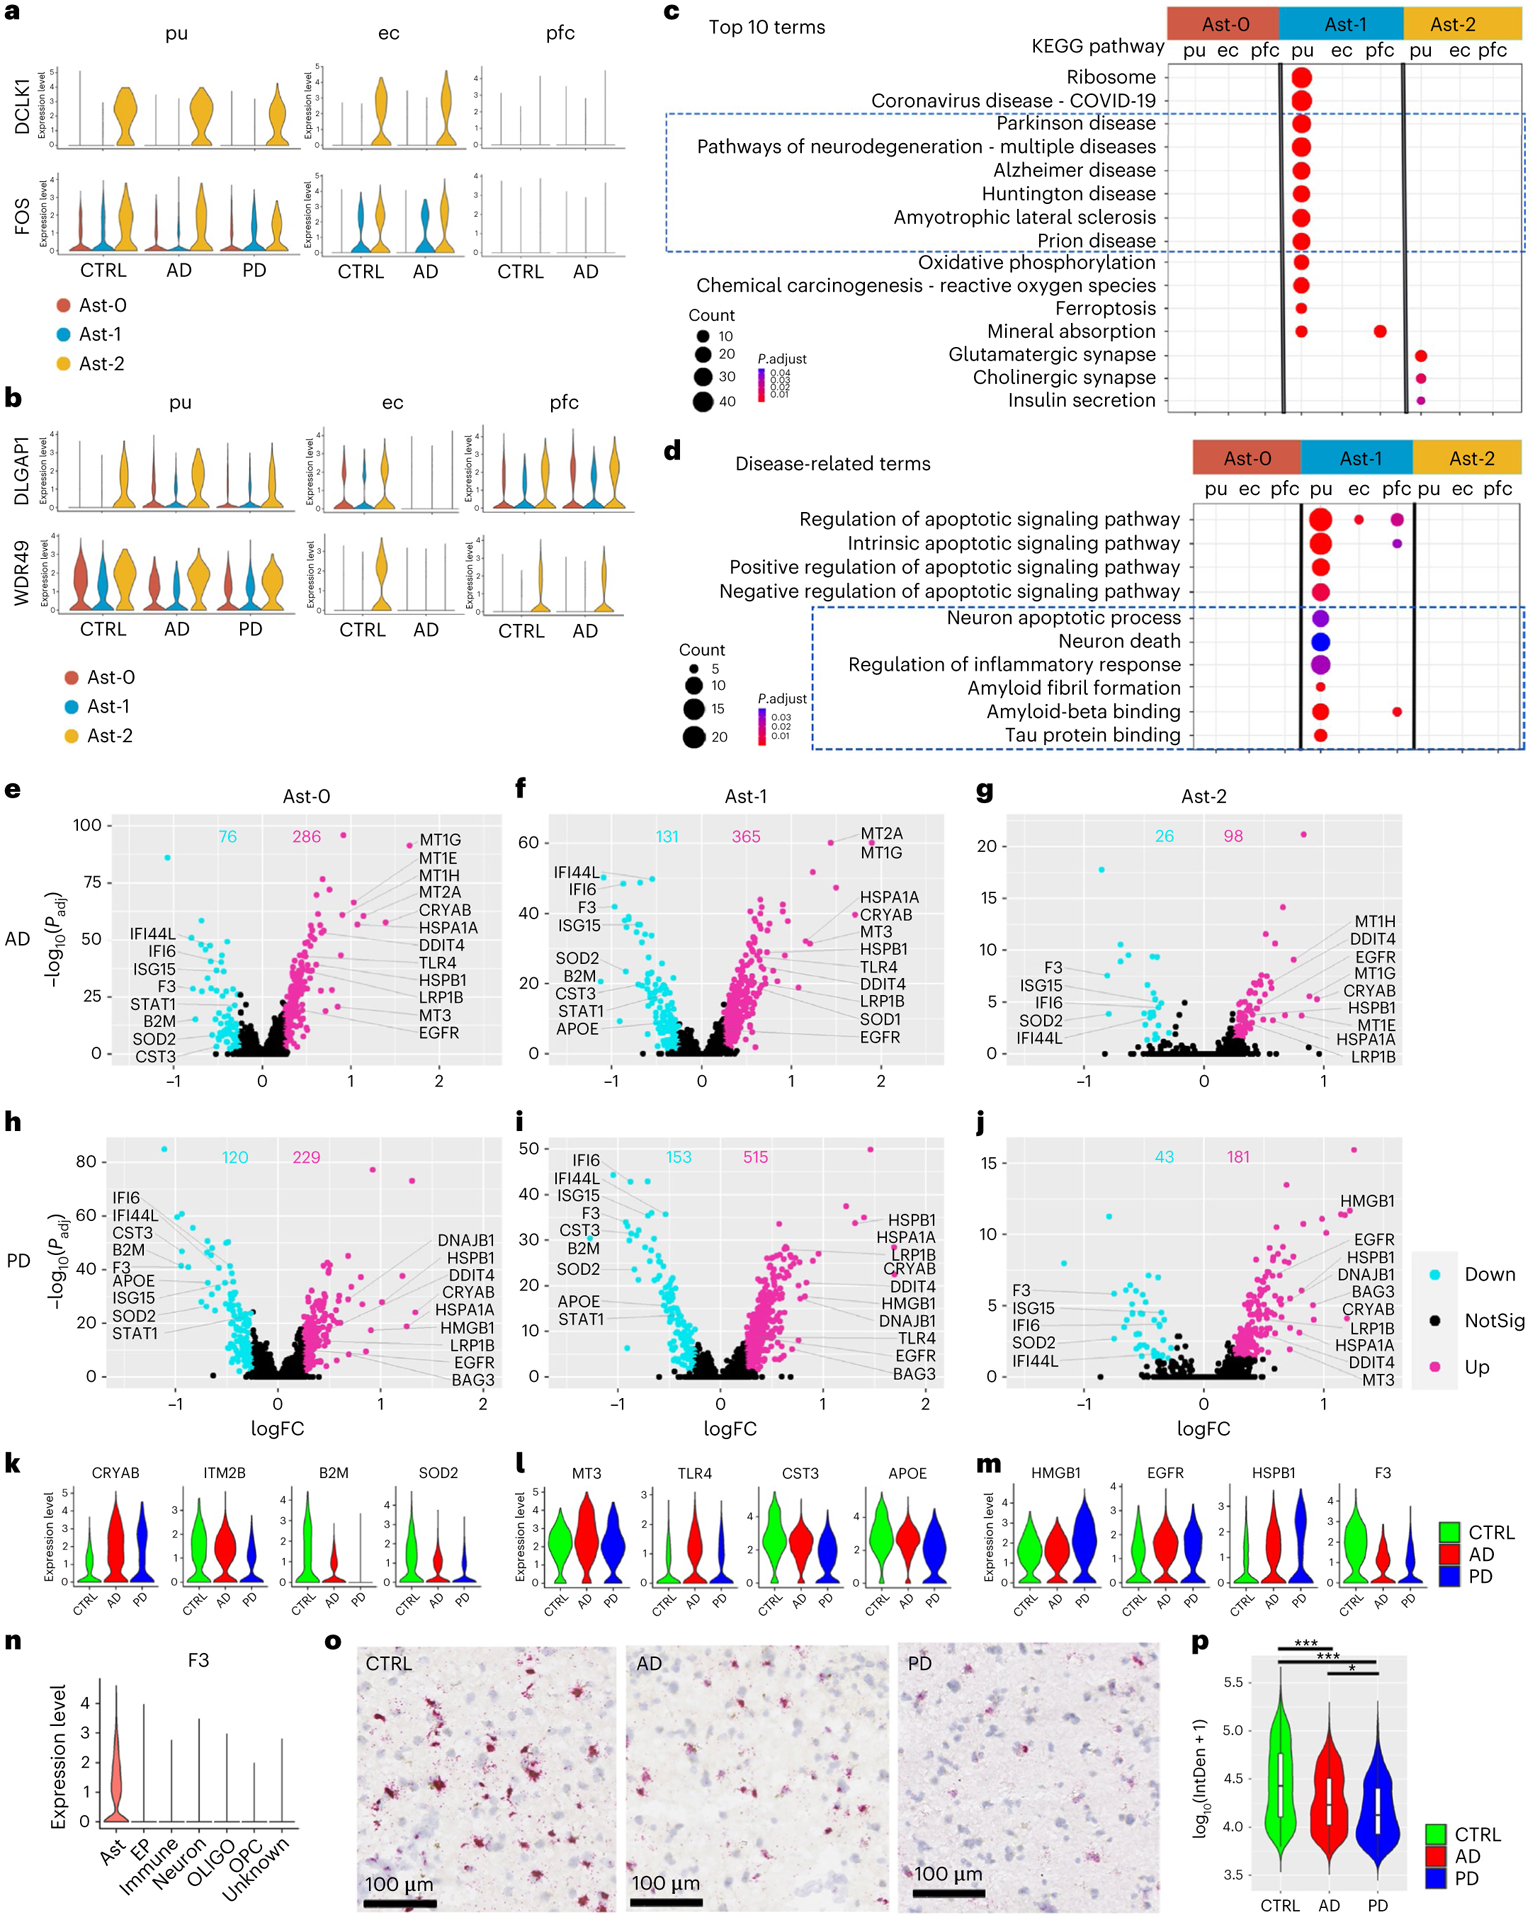
Fig. 2 |. Transcriptomic comparison of astrocyte subpopulations.

a,b, Violin plots showing genes with conserved expression patterns in the putamen and ec (a) or the putamen and pfc (b) in FindConservedMarkers using Wilcoxon rank sum test and metap R package with meta-analysis combined P value < 0.05). c,d, KEGG pathway terms (c) and disease-related GO terms (d) enriched in the subcluster conserved marker genes (false discovery rate (FDR)-adjusted P value < 0.05, hypergeometric test, ≥ 5 query genes). e–j, Volcano plots showing significant DEGs comparing cells from AD (e–g, Ast-0 = 834, Ast-1 = 553, Ast-2 = 255 cells) or PD (h–j, Ast-0 = 784, Ast-1 = 427, Ast-2 = 222 cells) with cells from the controls (CTRL, Ast-0 = 683, Ast-1 = 358, Ast-2 = 161 cells). The x-axis specifies the log fold changes (logFCs), and the y-axis specifies the negative logarithm to the base 10 of the adjusted P values (−log10(Padj)). Magenta and cyan dots represent genes upregulated and downregulated in disease brains, respectively (Wilcoxon rank sum test, FDR-adjusted P value < 0.05 and absolute logFC > 0.25 using natural logarithm (ln)). k–m, Violin plots showing the expression level distributions of example DEGs of Ast-0 (k), Ast-1 (l) and Ast-2 (m). n, Violin plots showing F3 gene expression in all major cell types in the putamen. o, Representative images of RNAScope in situ hybridization analysis of F3 transcript expression in the putamen. p, Single-cell F3 in situ hybridization signal from four images each for four subjects from each group were quantified, AD (n = 863 cells), PD (n = 387 cells) and control (CTRL, n = 1,120 cells) using one-way analysis of variance with Tukey’s multiple comparisons test, ***P < 0.001, *P < 0.05, AD versus CTRL P value < 0.001, PD versus CTRL P value < 0.001, PD versus AD P value = 0.016). Data are presented as mean values ± standard deviation (s.d.). Minima = 3.69, maxima = 5.41, mean CTRL = 4.63, AD = 4.38, PD = 4.27. The lower and upper hinges correspond to the 25th and 75th percentiles. The upper/lower whisker extends from the hinge to the largest/smallest value no further than 1.5× interquartile range from the hinge. Down: downregulated; Up: upregulated; NotSig: not statistically significant; log10(IntDen + 1): logarithm to the base 10 of the integrated density.
