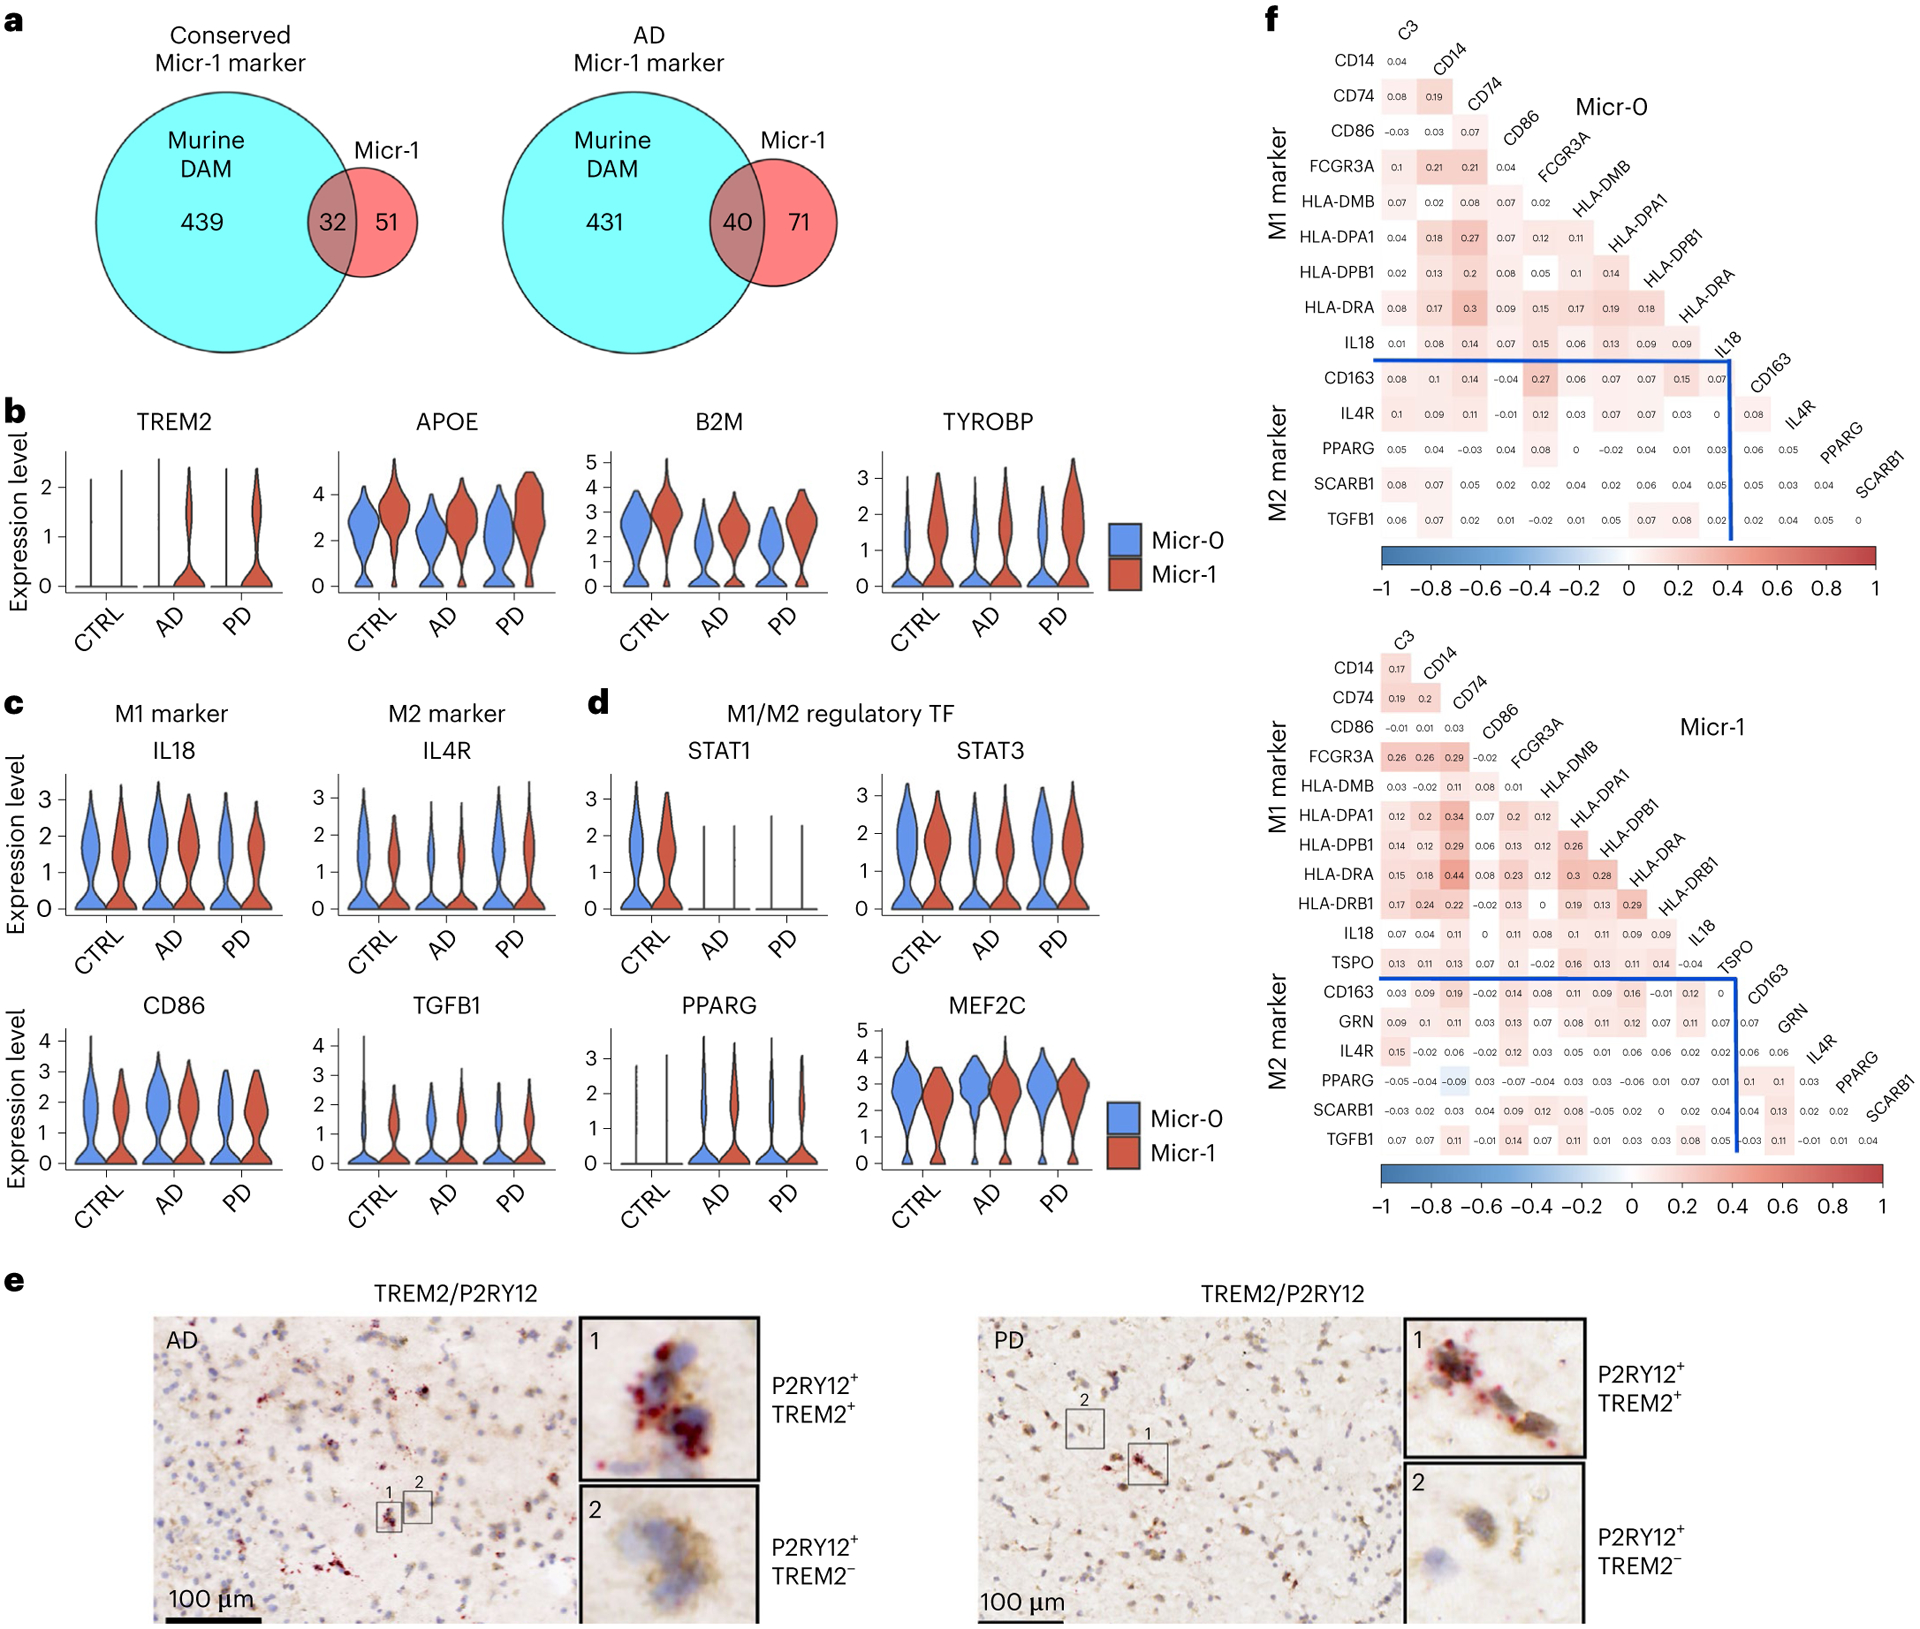
Fig. 5 |. Characterization of the human activated microglia.

a, Venn diagram demonstrating overlap (hypergeometric test) between murine DAM marker genes and the conserved marker genes of human activated microglia (Micr-1) of AD, PD and controls (left, P value = 6.46 × 10⁻³³) or marker genes of AD-only human activated microglia (right, P value = 3.03 × 10−40). b–d, Violin plots showing the expression level distributions of (b) TREM2, APOE, B2M and TYROBP; (c) M1- and M2- microglia markers; (d) M1- and M2- microglia regulatory transcription factors (TF). e, Immunohistochemistry staining (brown) of marker protein P2RY12 and RNAscope in situ hybridization analysis (red) of TREM2 transcript expression in the adjacent tissue sections from the putamen of an AD and a PD case. For all data, the experiment was performed once. Hematoxylin-positive cell nuclei are shown in blue. f, Heatmap of Pearson’s correlation coefficient of M1- and M2- microglia marker gene expression for Micr-0 and Micr-1 microglia respectively. The shade of the color represents the significance levels (FDR-correlated P value < 0.05). The color represents the directionality of correlation. APOE, B2M and TYROBP were determined to be conserved cluster marker for Micr-1 by FindConservedMarkers using Wilcoxon rank sum test and metap R package with meta-analysis combined P value < 0.05 comparing gene expression in Micr-1 cluster with the other cell clusters for AD (n = 4), PD (n = 4), and the controls (n = 4). Scale bars, 100 μm.
