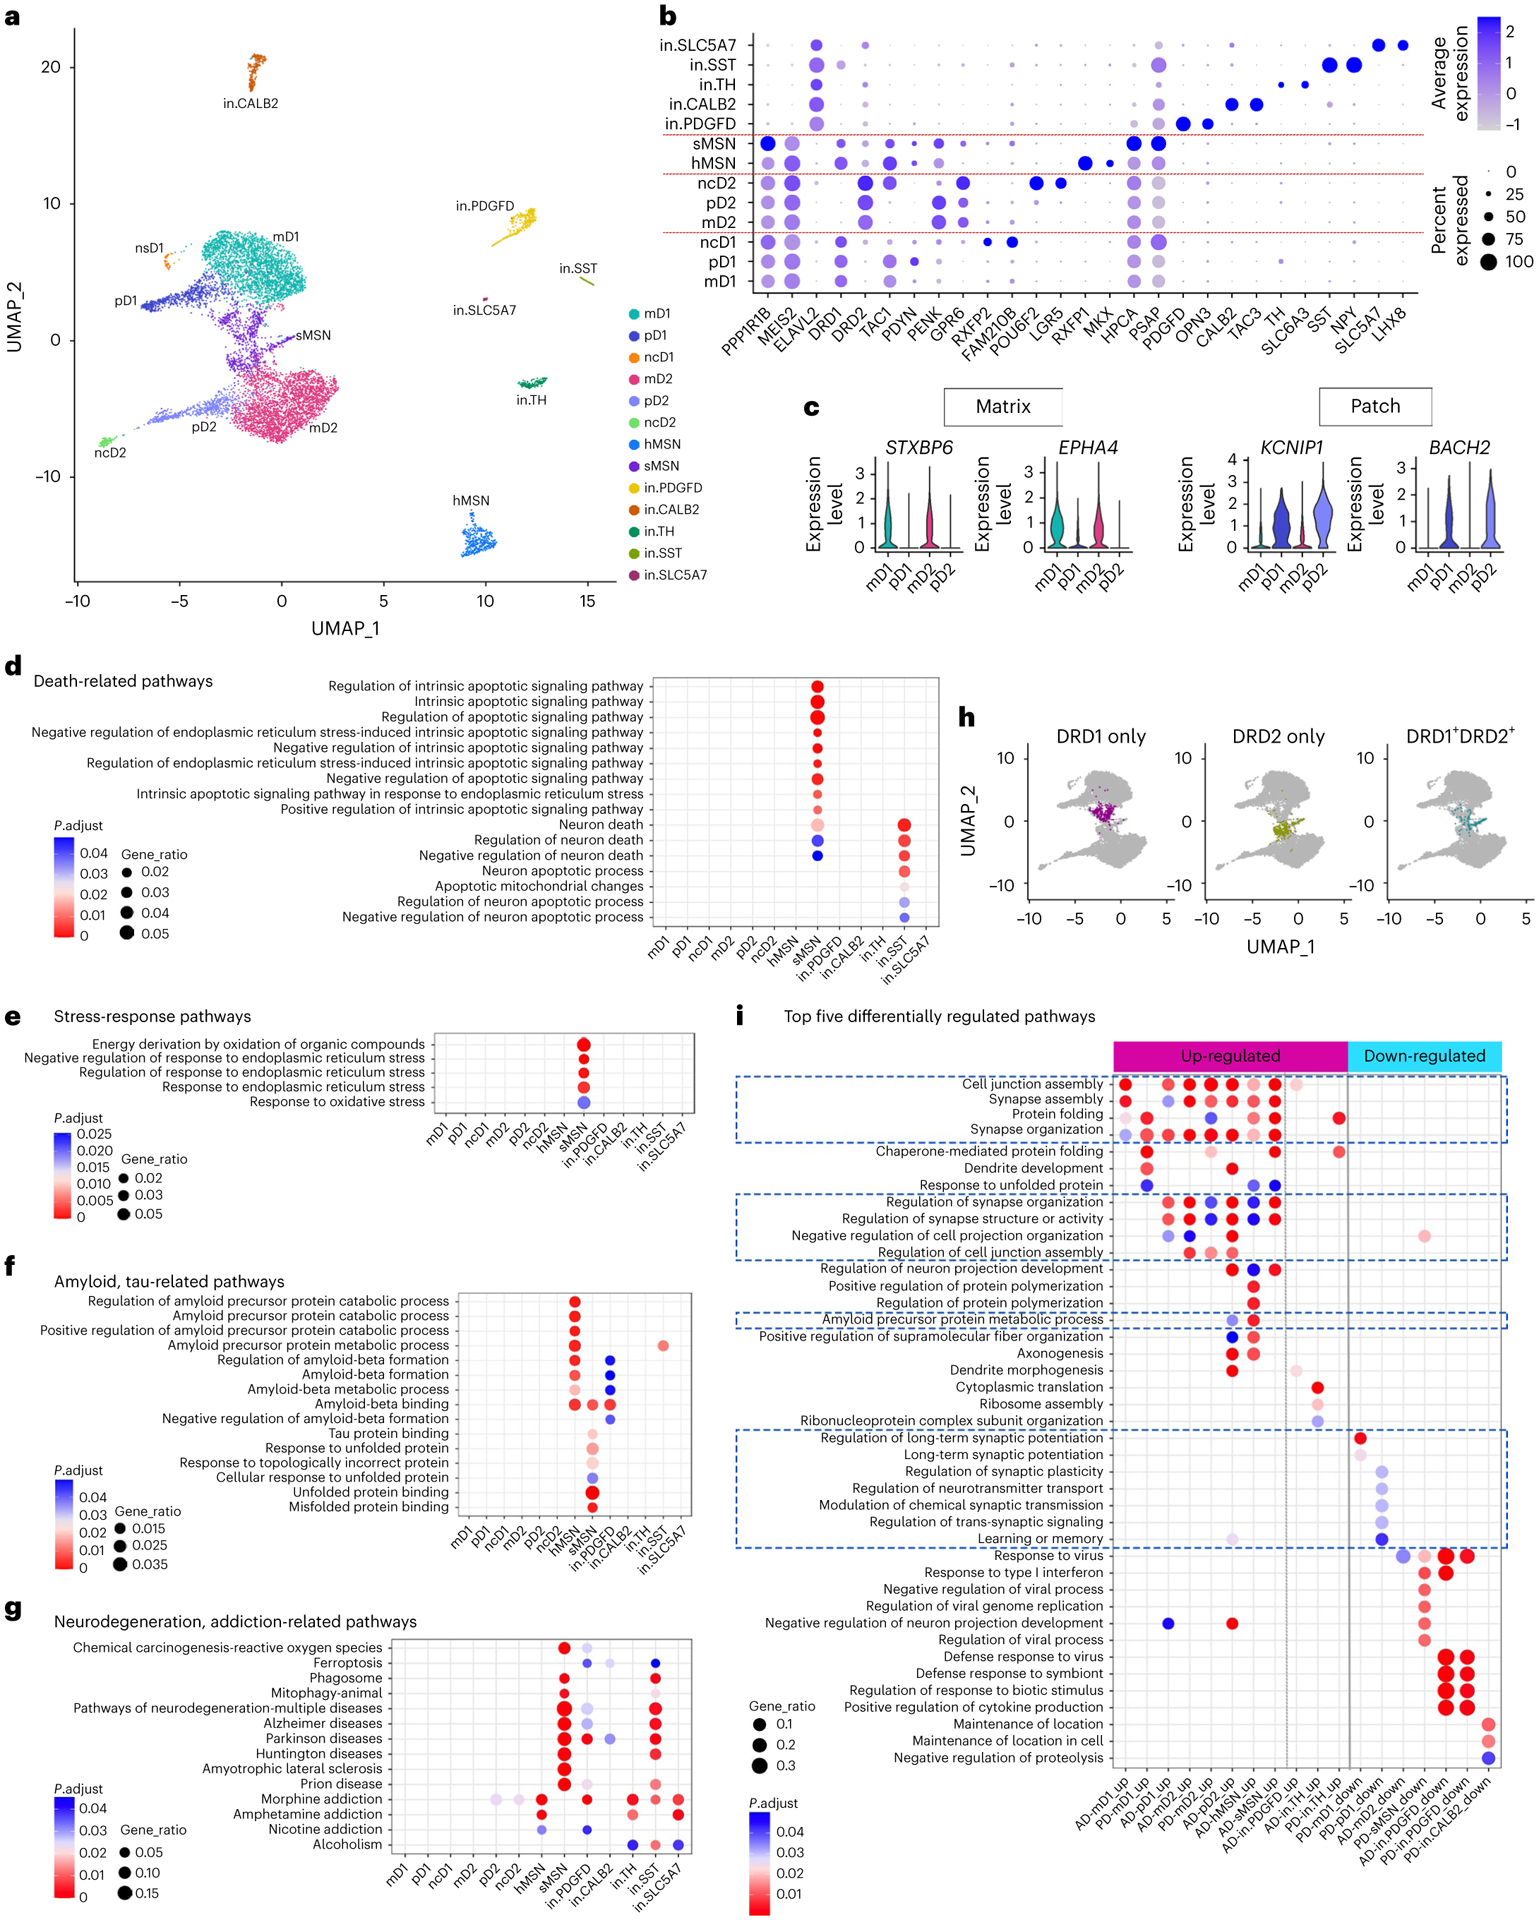
Fig. 8 |. Characterization of neuronal subpopulations and gene expression changes in disease conditions.

a, UMAP visualization of neuron subpopulations colored by cluster identity. b, Dot plot of neuronal subpopulation conserved marker gene expression (FindConservedMarkers using Wilcoxon rank sum test and metap R package with meta-analysis combined P value < 0.05). c, Violin plot showing the expression of matrix- and patch-compartment marker gene expression in mD1, pD1, mD2 and pD2 neurons (FindConservedMarkers using Wilcoxon rank sum test and metap R package with meta-analysis combined P value < 0.05). d–f, GO terms enriched in the conserved cluster marker genes of each neuronal subpopulation related to cell death (d), stress response (e), amyloid and tau metabolism and unfolded protein response pathways (f). g, Neurodegeneration and addiction-related KEGG pathway terms enriched in the conserved cluster marker genes of each neuronal subpopulation. h, UMAP visualization of MSN neuron subpopulations with sMSN colored by cells expressing only DRD1 (left), only DRD2 (middle) or both DRD1 and DRD2 (right). i, Top five GO terms in the Biological Process category enriched in the DEGs of each neuronal subpopulation in AD and PD. Only cell subpopulations with enriched GO terms are shown. Pathways with FDR-adjusted P value < 0.05 (hypergeometric test) and at least five query genes were considered statistically significant.
