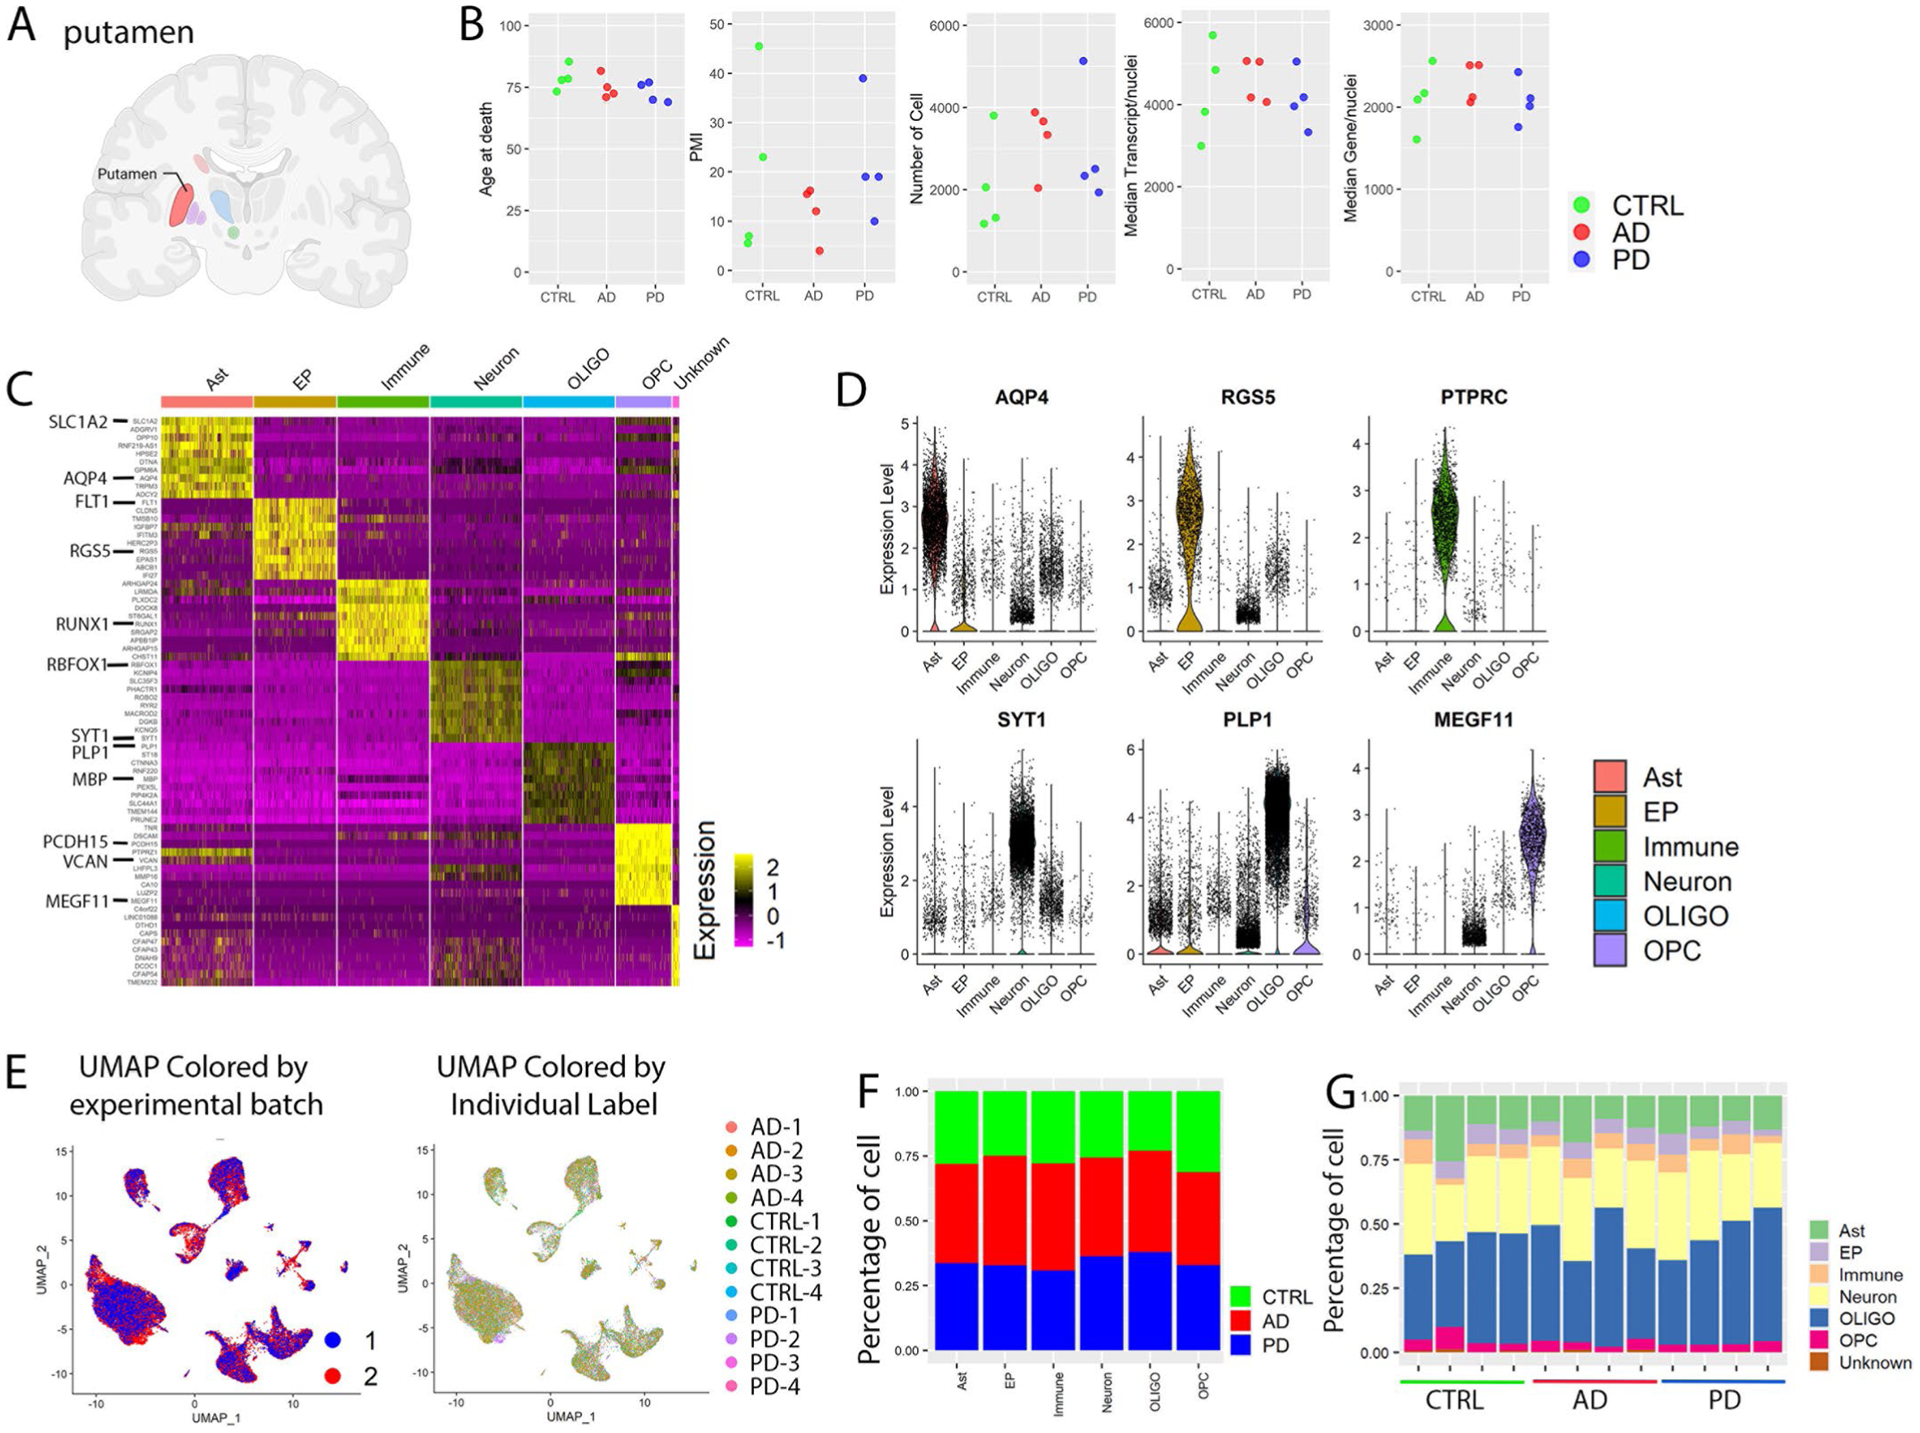
Extended Data Fig. 1 |. snRNA-seq profiling and characterization of major cell types.

a, Brain region analyzed with snRNA-seq. Created with BioRender. com. b, Comparison of age, postmortem interval (PMI), number of cells, the median number of transcripts and median number of genes per nucleus among control, AD and PD groups. c, Heatmap of the relative expression level of top 10 marker genes for each cell type. d, Violin plots of gene expression levels of known cell-type-specific marker genes. e, UMAP plot colored by experimental batch or individual label. UMAP were generated using the same parameters as described in Fig. 1. f,g, Percentage of cells from (f) each disease group or (g) individuals of each disease group in each of the major cell type. Ast: Astrocyte; EP: Endothelia cell and pericyte; Immune: Immune cell including microglia; OLIGO: Oligodendrocyte; OPC: Oligodendrocyte precursor cell. Conserved marker genes were determined by FindConservedMarkers using Wilcoxon Rank Sum test and metap R package with meta-analysis combined P value < 0.05 comparing gene expression in the given cluster with the other cell clusters for AD (n = 4), PD (n = 4) and the controls (n = 4).
