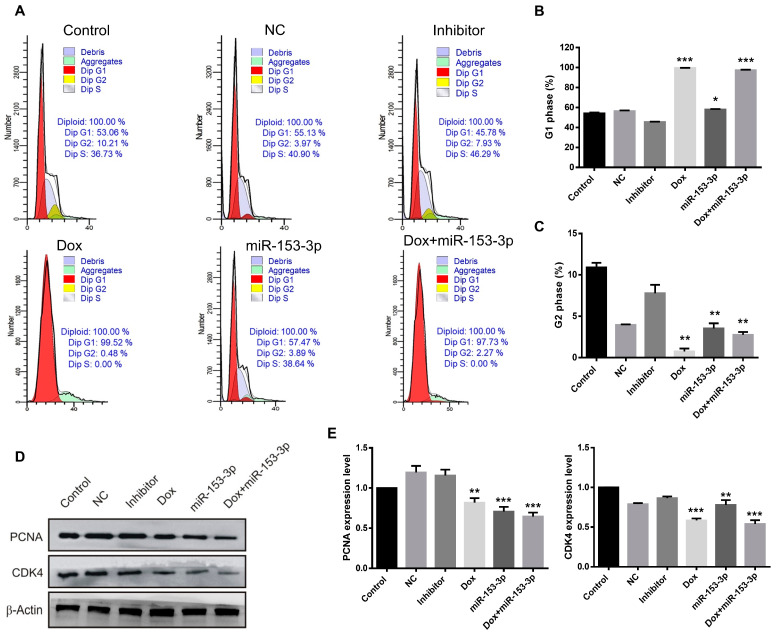
Figure 8.
Effects of miR-153-3p, Dox, and miR-153-3p+Dox treatment on the cell cycle in MCF-7 cells. (A) Cell cycle phase distribution by flow cytometry. (B,C) Quantification of the G1 and G2 phases. (D,E) Western blotting of CDK4 and Cyclin D1 and their quantification (* p < 0.05; ** p < 0.01; *** p < 0.001, original blot see Supplementary File S1).

