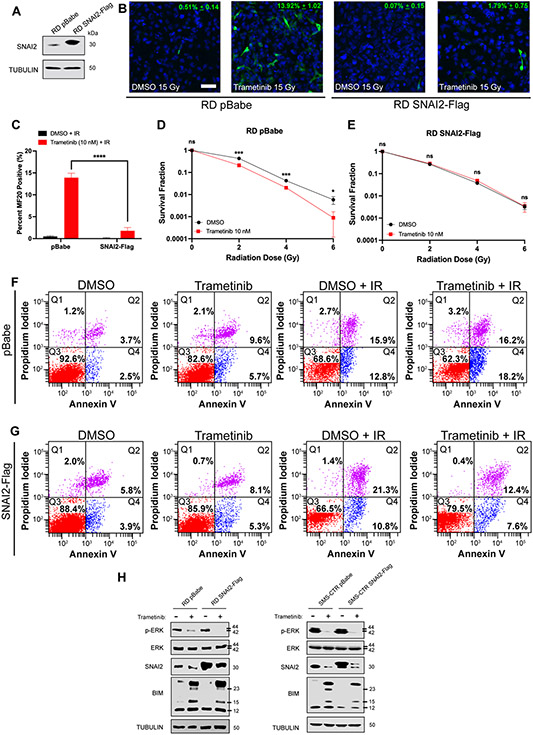
Figure 3. SNAI2 downstream of MEK signaling protects FN-RMS from IR-induced myogenic differentiation and apoptosis.
A. SNAI2 protein expression in RD pBabe and SNAI2-Flag overexpressing cell lines.
B. Representative confocal microscopy images of RD pBabe and SNAI2-Flag cells treated with DMSO or trametinib after IR exposure, immunostained with myogenic differentiated myosin MF20 antibody. Scale bar = 100 μm.
C. Quantification of average MF20-positive cells in DMSO- and trametinib-treated RD pBabe and SNAI2-Flag cells after IR exposure. Error bars represent ±1 SD. ns = not significant, ****p<0.0001 by a two-way ANOVA with a posthoc Sidak’s multiple comparison test.
D, E. Survival fractions of DMSO- and trametinib-treated RD pBabe and SNAI2-Flag cells were assessed at increasing IR dose exposures. Statistical differences were observed at 2, 4, and 6 Gy in RD pBabe, but NOT RD SNAI2-Flag. Error bars represent ±1 SD. ns = not significant, *p < 0.05, ***p < 0.001 by a Student’s t-test.
F. Flow cytometry plots showing propidium iodide vs. annexin V staining of DMSO- and trametinib-treated RD pBabe cells after non-IR and IR conditions.
G. Flow cytometry plots showing propidium iodide vs. annexin V staining of DMSO- and trametinib-treated RD SNAI2-Flag cells after non-IR and IR conditions.
H. Western blots showing pERK, total ERK, and BIM protein expression of RD pBabe, RD SNAI2-Flag, SMS-CTR pBabe, and SMS-CTR SNAI2-Flag cells after DMSO and 10 nM trametinib treatment.

