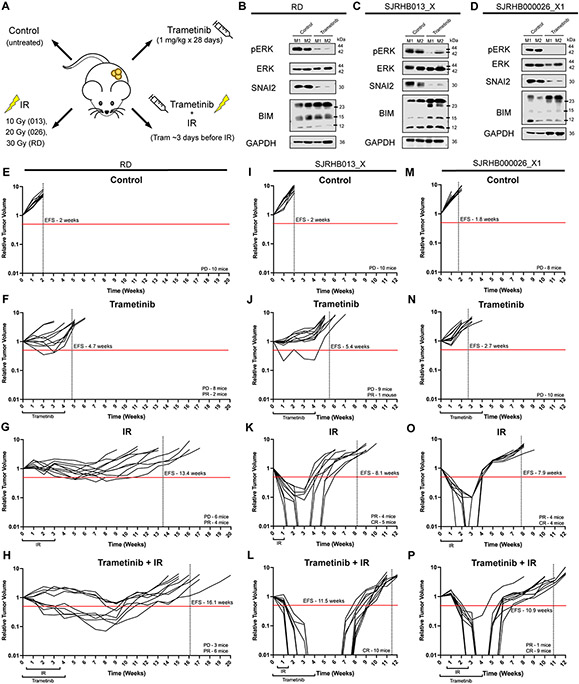
Figure 4. MEK inhibitor treatment results in loss of SNAI2 and increases sensitivity to IR, resulting in increased event-free survival in preclinical models.
A. Illustration of in vivo experimental treatment set up.
B–D. Western blots showing pERK, total ERK, SNAI2, and BIM protein expression in two representative control tumors and trametinib-treated RD (B), SJRHB013_X (C), and SJRHB000026_X1 (D) tumors.
E–H. Relative tumor volume (RTV) of RD tumors receiving control (E), trametinib (F), IR (G), or combination trametinib + IR (H) treatment. Red line depicts 0.5 RTV; vertical dashed line represents the average EFS for each treatment arm. PD: progressive disease, PR: partial response.
I–L. Relative tumor volume (RTV) of SJRHB013_X tumors receiving control (I), trametinib (J), IR (K), or combination trametinib + IR (L) treatment. Red line depicts 0.5 RTV; vertical dashed line represents the average EFS for each treatment arm. PD: progressive disease, PR: partial response. CR: complete response. M–P. Relative tumor volume (RTV) of SJRHB000026_X1 tumors receiving control (M), trametinib (N), IR (O), or combination trametinib + IR (P) treatment. Red line depicts 0.5 RTV; vertical dashed line represents the average EFS for each treatment arm. PD: progressive disease, PR: partial response. CR: complete response.

