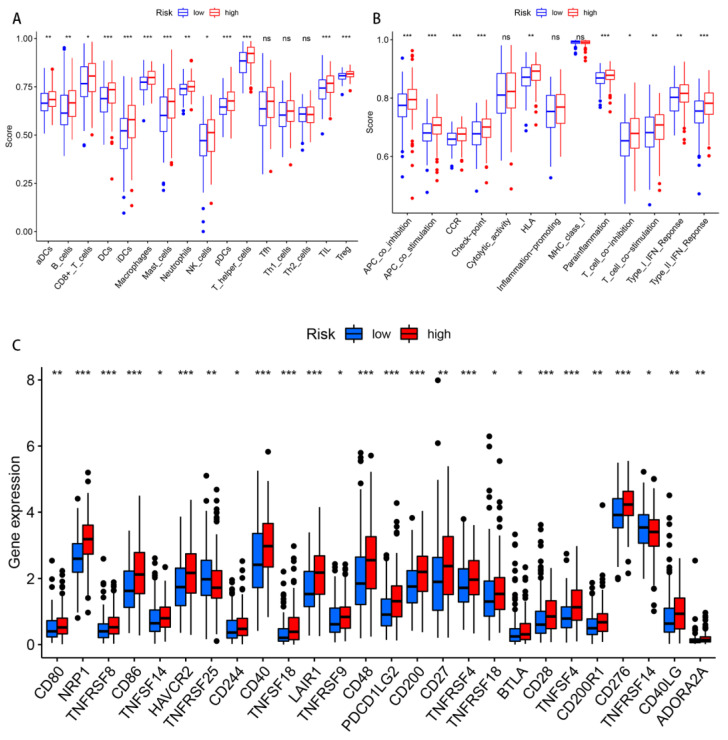
Figure 9.
Differences in the immune-infiltrating cells and immune-related functions between the two risk groups. (A,B) The infiltration levels of the immune cells, as well as the immune-related function scores in the high- and low-risk groups. (C) The expression of the immune checkpoints in both risk groups. Abbreviations—ns: non-significant. * p < 0.05; ** p < 0.01; and *** p < 0.001.

