Figure 3.

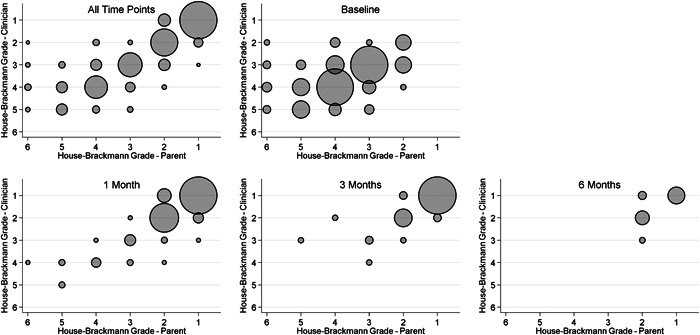
Scatterplot of clinician‐ versus parent‐administered House‐Brackmann scores. The size of the circles are proportional to the frequency that the given combination of scores was observed.

Scatterplot of clinician‐ versus parent‐administered House‐Brackmann scores. The size of the circles are proportional to the frequency that the given combination of scores was observed.