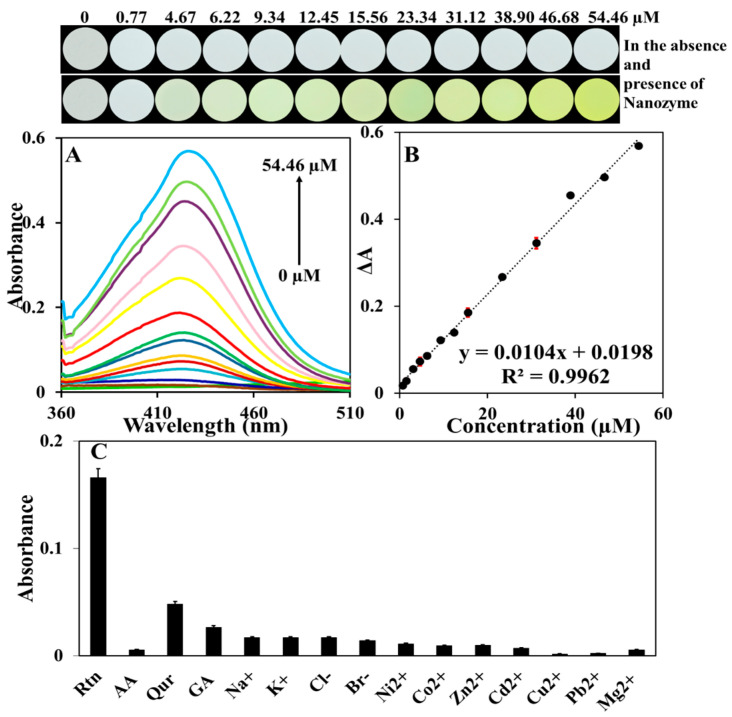
Figure 4.
(A) UV–Vis spectra of different concentrations of Rtn including 0, 0.77, 1.56, 3.11, 4.67, 6.22, 9.34, 12.45, 15.56, 23.34, 31.12, 38.9, 46.68, and 54.46 µM in the presence of Cu-Guo NRs nanozyme under optimum condition (from bottom to top). (B) Calibration curve resulting from the change of the absorbance signal (ΔA) vs. different concentrations of Rtn with low error bar values, along with the recorded images for different concentration of Rtn in the presence and absence of nanozyme. (C) The absorbance spectra of the sensor response in the presence of common interfering species such as Qur (33.08 µM), AA (567.79 µM), and GA (235.13 µM) and various ions including (2.558 mM), (4.349 mM), (2.820 mM), (1.251 mM), (1.703 mM), (1.696 mM), (1.529 mM), (8.895 mM), (1.573 mM), (0.482 mM), and (4.114 mM) in the determination of 16.38 µM Rtn.

