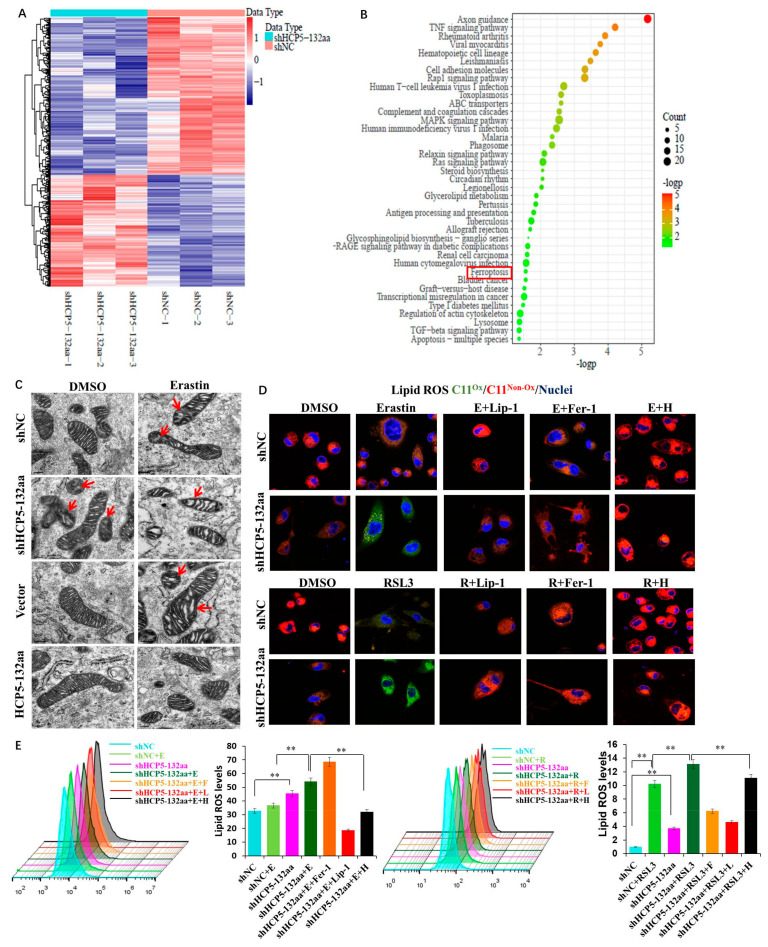
Figure 4.
HCP5-132aa ORF knockdown promoted ferroptosis and increased ROS production. (A) The heatmap of DEGs between shNC and shHCP5-132aa MDA-MB-231 cells. (B) KEGG pathway enrichment analysis of the DEGs. The red square emphasizes the ferroptosis pathway. (C) Mitochondrial morphological changes stimulating with Erastin in HCP5-132aa ORF knockdown or overexpressed MDA-MB-231 cells were observed using TEM (red arrows show the reduced mitochondrial crests) (×8000). (D) MDA-MB-231 cells were treated with DMSO (D, 1 μM), Erastin (E, 15 μM), RSL3 (R, 1.25 μM), Liproxstatin-1 (Lip-1, 50 μM), Ferrostatin-1 (Fer-1, 1 μM) or HCP5-132aa ORF overexpression plasmid (H, 30 μL) for 48 h, respectively. Confocal images of C11 BODIPY 581/591 were obtained. Cells were labeled with C11 (5 μM) and Hoechst (1 μg/mL) prior to imaging. C11Ox: oxidizedC11; C11Non-Ox: non-oxidized C11 (×1000). (E) ROS generation was quantified by flow cytometry, as described in Section 2. Images were representative of three independent experiments. ** p < 0.01.

