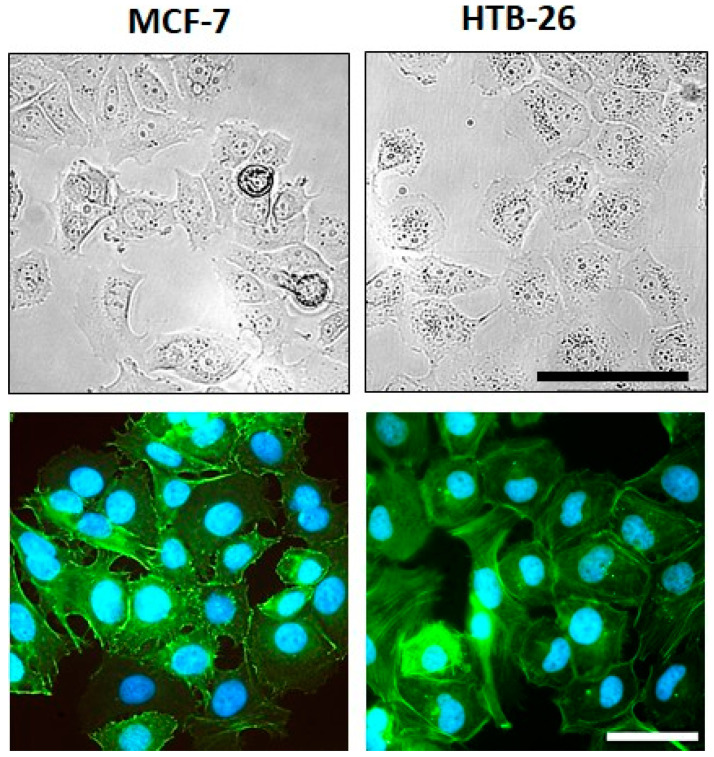
Figure 2.
Morphology and F-actin organization of MCF-7 and MDA-MB-231 breast cancer cells. (Upper row) Representative images of the cell morphology of MCF-7 and MDA-MB-231 breast cancer cells at ~70–80% confluency in adherent culture; scale bar: 100 µm (applies to both cell lines). (Lower row) Examples of fluorescence images of the F-actin organization in MCF-7 and MDA-MB-231 breast carcinoma cells; green—F-actin; blue—nuclei; scale bar: 50 µm (applies to both cell lines).

