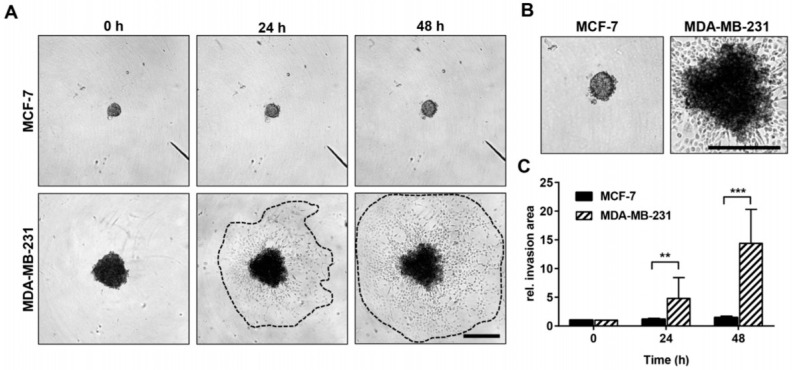
Figure 3.
Invasive growth rate of MCF-7 and MDA-MB-231 breast cancer cells in vitro. (A) Representative light microscopy images of MCF-7 and MDA-MB-231 spheroids and their surrounding invasion area 0 h, 24 h, and 48 h after embedment into an artificial Matrigel ECM. Dotted lines mark the boundaries of the invasion area of MDA-MB-231 cells. Scale bar: 500 µm (applies to both cell lines and all images). (B) Digitally enlarged images of MCF-7 and MDA-MB-231 spheroids already shown in (A) after 48 h of incubation. Scale bar: 500 µm (applies to both cell lines and all images). (C) Time-dependent invasive growth rate of MCF-7 (n = 16) and MDA-MB-231 (n = 16) cells (defined as relative invasion area) as determined by dividing the measured invasion area (24 h and 48 h) by the initial spheroid size (area occupied by spheroids at 0 h). Mann-Whitney test: values represent means ± standard deviations (SD). ** indicates p < 0.01; *** indicates p < 0.001.

