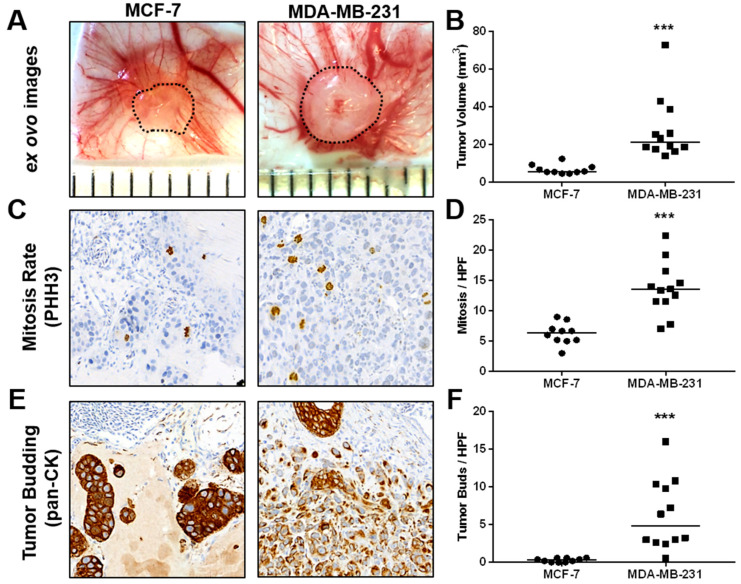
Figure 4.
In vivo growth and characterization of tumor aggressiveness of MCF-7 and MDA-MB-231 breast cancer cells in the CAM xenograft assay. (A) Example ex ovo images of CAM ovografts harvested five days post-engraftment of MCF-7 and MDA-MB-231 cells onto the CAM of fertilized SPF chicken embryos. Scattered lines indicate tumor boundaries. Individual ruler segments define a length of 1 mm. (B) Tumor volume of ovografts after 5 days of incubation on the CAM. (C) Representative images of mitotic figures as detected in PHH3-stained tissue sections of MCF-7 and MDA-MB-231 CAM ovografts. (D) In vivo mitotic rate of MCF-7 and MDA-MB-231 cells as determined by the average number of mitotic figures per high-power field (HPF) in PHH3 IHC-stained tissue sections of CAM ovografts. (E) Example images of pancytokeratin-stained tissue sections of MCF-7 and MDA-MB-231 CAM ovografts as applied for the assessment of invasiveness and tumor budding at the tumor invasion front. (F) Tumor budding rate of MCF-7 and MDA-MB-231 cells as determined by the average number of tumor buds per HPF at the tumor invasion front in pancytokeratin-stained tissue sections of CAM ovografts. All data are presented with medians, and statistical analyses were performed using the Mann-Whitney test; MCF-7: n = 10, MDA-MB-231: n = 12; *** indicates p < 0.001.

