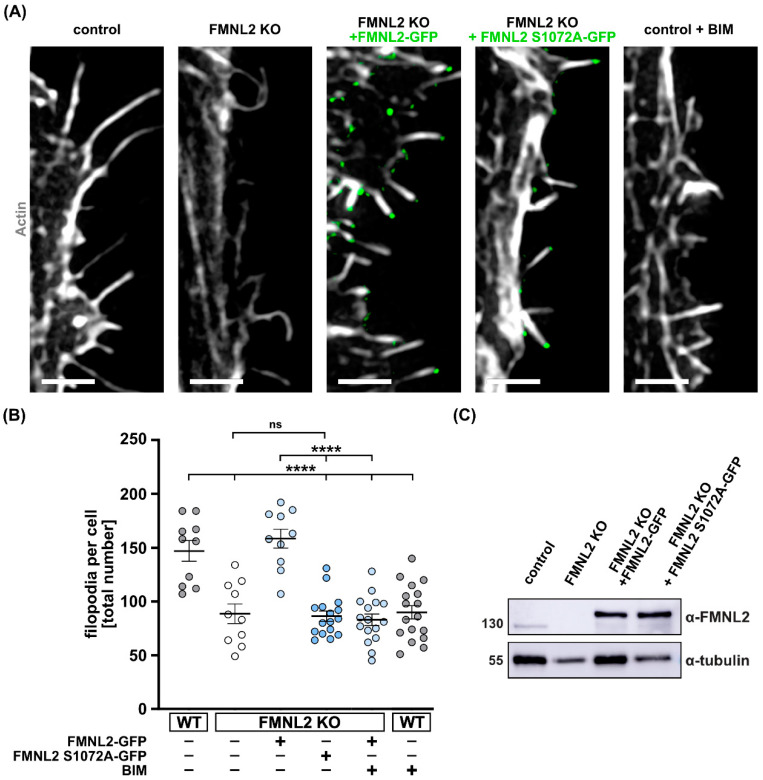
Figure 3.
FMNL2-phosphorylation at S1072 by PKCs is involved in filopodia formation. Sections of MCF10A control (wildtype), FMNL2 KO and rescue cells (FMNL2 KO + FMNL2-GFP and FMNL2 KO + FMNL2 S1072A-GFP; green) exhibiting filopodia (A) and quantification of filopodia number per cell (B). Cells were transfected with actin-chromobody SNAP (white, SNAP-cell 647 SiR). Control cells and FMNL2 KO rescue cells were also treated with PKC inhibitor BIM (2 μM, 30 min). Scale bar = 2 μm. Data are shown as scatter plots with median (solid line) +/− SEM. Each spot represents an individual cell from at least three independent biological replicates. At least 10 cells were analyzed. For statistical analysis, one-way ANOVA with Tukey’s multiple comparisons test was used (**** = p < 0.0001; ns = not significant). Indicated drug treatments or expressions are labeled with (+). Absence of expression or treatment is labeled with (-). (C) Western blot analysis for FMNL2 of control, FMNL2 KO and rescue- cells.

