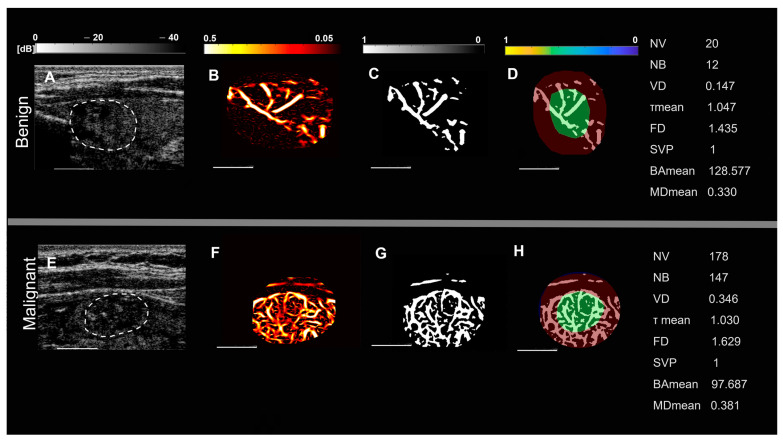
Figure 2.
Representative images of small thyroid nodules < 20 mm, benign (top row) and malignant (bottom row). (A,E) are B-mode ultrasound images (dashed white circles delineate the boundaries of the nodules), (B,F) HDMI images, showing tumor microvessels, (C,G) are binary images of microvessels, (D,H) spatial vascularity pattern (SVP) diagrams, (green circles represent the central region and the red ones the peripheral region of the nodule). The correspondent quantitative biomarkers are displayed on the right side of each row. The white line denotes a scale of 1 cm.

