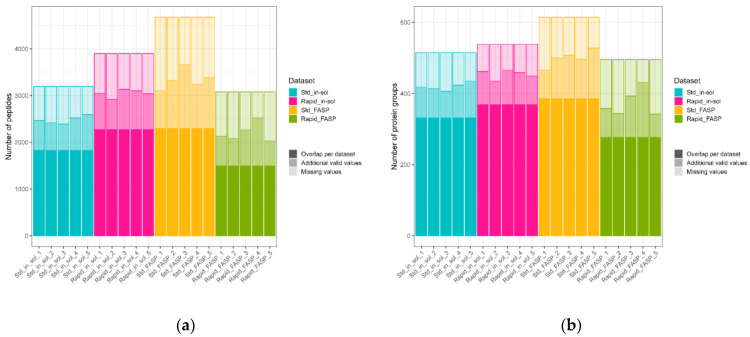
Figure 8.
Number of quantified peptides and PGs and data completeness. Peptides (a) and PGs (b) were quantified by intensity using MaxQuant. In a dark tint, the number of consistent identifications for the corresponding dataset (overlapping for five replicates) is displayed. The dark tint and the one level lighter tint together indicate the total number of identifications in a sample. The lightest tint corresponds to the missing values in a sample. The highest data consistency was detected for the standard FASP and rapid in-solution digestion datasets. The lowest data consistency and the least reproducible results containing the most missing values were obtained for rapid FASP.

