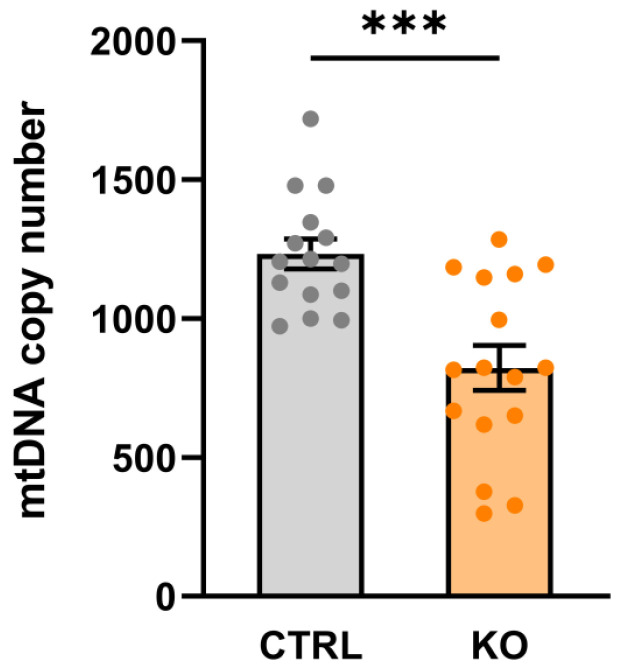
Figure 1.
mtDNA copy number in TSPO−/− and control C20 cell lines. Data are presented as single values of six RT-PCR ± SEM (n = 3 biological replicates). The mtDNA copy number is significantly decreased in the TSPO-KO compared to the control cells (stars indicate significance p = 0.0003; Welch’s corrected t-test).

