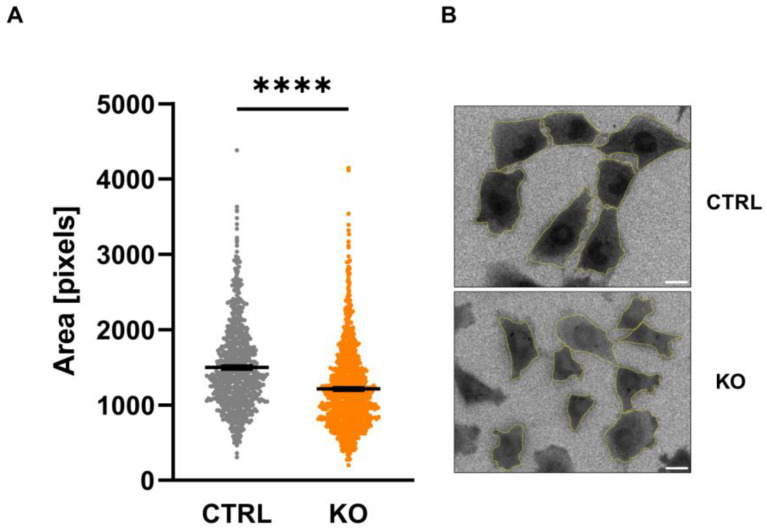
Figure 4.
Size of C20 microglia cells. The area of C20 microglia cells was assessed by counting the number of pixels visualized after loading the cells with Fura-2 (A) (CTRL 1498 ± 21.86 vs. KO 1213 ± 15.97; p < 0.0001; n = 3; Mann–Whitney U test). Exemplary image indicating Fura-2-loaded cells (ratio image), and the analyzed region of interest is shown in (B). Scale bar: 20 µm. Stars indicate significance.

