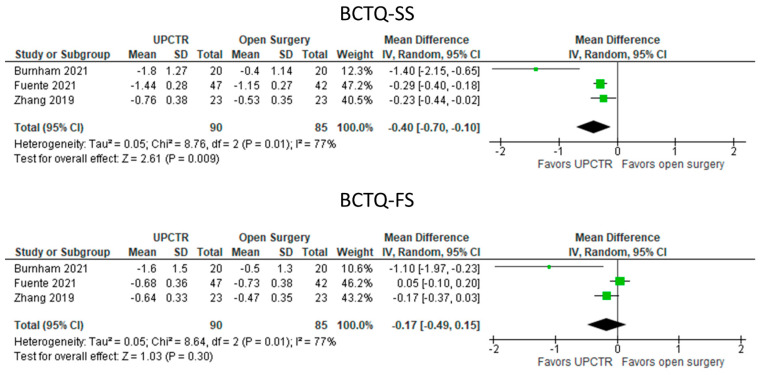
Figure 7.
Meta—analysis of UPCTR vs. surgery. BCTQ—SS, The Boston Carpal Tunnel Questionnaire—symptom scale; BCTQ—FS, The Boston Carpal Tunnel Questionnaire—functional scale. The green squares represent the differences between the means of each of the two groups compared, i.e., the mean differences. The size of the green square represents how much that individual study affects the overall outcome of the meta—analysis, i.e., the weight of the studies on the meta—analysis. The precision of the study depends on the 95% confidence interval for that mean difference, i.e., the length of the straight lines, the shorter the lines, the more precise the mean differences. The black trapezoid is the pooled mean difference of all the studies combined in consideration of the weight of each study, with its confidence interval extending from the left tip to the right tip.

